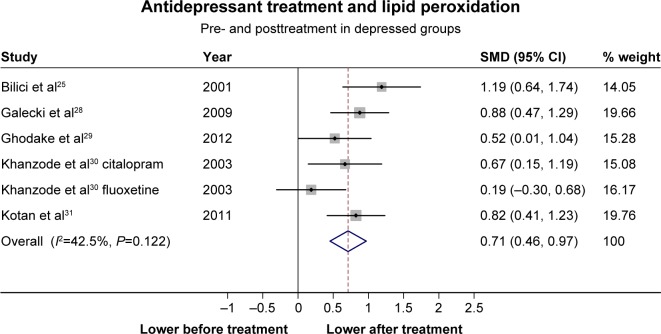
Figure 3.
Changes in concentrations of lipid peroxidation markers in depressed groups before and after treatment with an antidepressant pharmacotherapy.
Notes: SMDs and random effects models were used. Summary statistics: five studies, N=222 depressed. SMD =0.71 (0.46–0.97), z=5.43, P<0.01. Heterogeneity: Q=8.70, df=5, P=0.12, I2=42.5%.
Abbreviations: CI, confidence interval; SMD, standardized mean difference.

