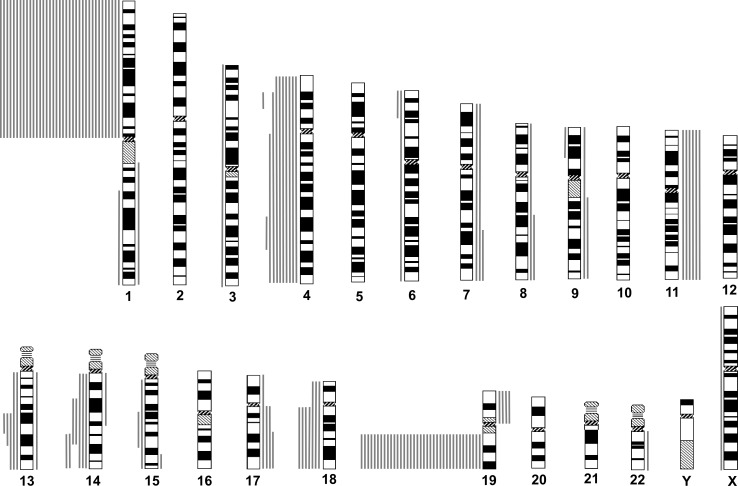
Figure 1. Chromosomal copy number aberrations (CNAs) of oligodendroglial gliomas with total 1p19q loss, as determined by institutional diagnosis.
Lines to the left of each idiogram represent regions of reduced relative DNA copy number, and lines to the right represent regions of increased relative DNA copy number. Each line represents a CNA found in one tumor.

