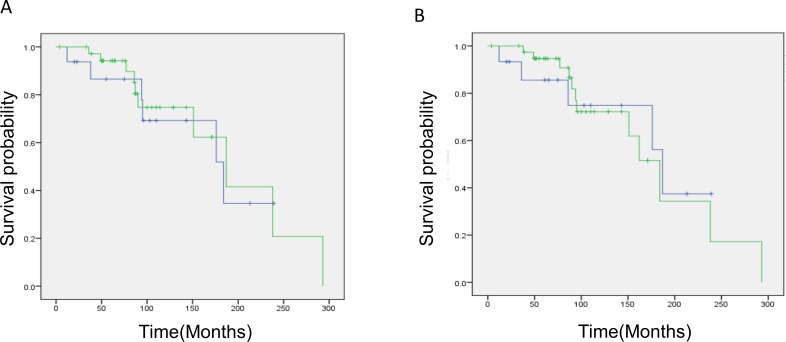
Figure 3. Kaplan–Meier survival analysis of oligodendroglial and astrocytic gliomas with total 1p19q loss.
a. by institutional diagnosis: The green line represents oligodendroglial tumors and the blue line represents astrocytic tumors. Median OS: oligodendroglial 187 months, astrocytic 184 months (p = 0.828). b. by single pathologist diagnosis: The green line represents oligodendroglial tumors and the blue line represents astrocytic tumors. Median OS: oligodendroglial 184 months, astrocytic 187 months (p = 0.84). Note that there is no difference in survival estimation between the two histological groups.

