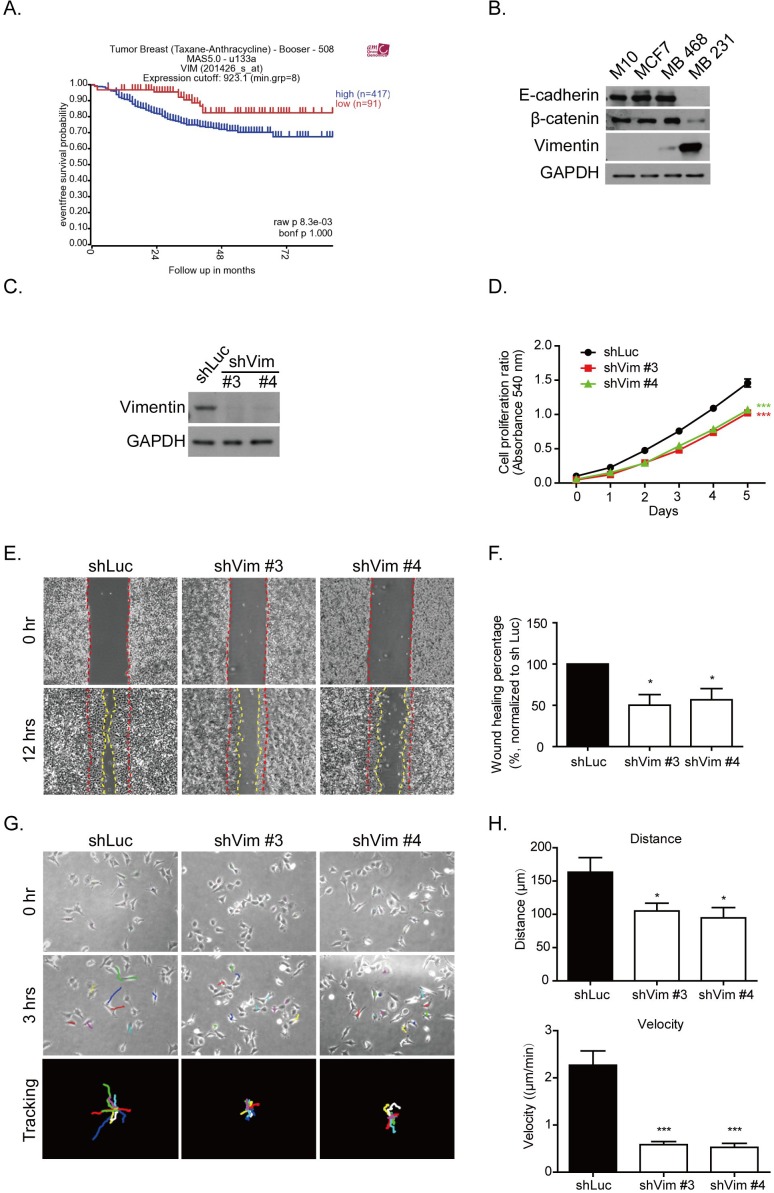
Figure 1. Vimentin expression contributes to breast cancer malignancy.
A. Kaplan-Meier analysis of event-free survival rate in breast cancer patients with vimentin mRNA expression. These patients were treated with chemotherapy drugs containing sequential Taxane- and Anthracycline-based regimens. The blue line indicates a high vimentin mRNA expression (n = 417), and the red line indicates a low vimentin mRNA expression (n = 91). The p value was 0.0083. Data were obtained from the R2 microarray public database (http://r2.amc.nl), Tumor Breast (Taxane-Anthracycline)-Booser-508 MAS5.0-u133a. B. Levels of several proteins from the normal breast epithelial cell line, M10, and three breast cancer cell lines, MCF7, MDA-MB 468, and MDA-MB 231, were analyzed using Western blotting. Cell lysate was collected after 24 hours of seeding. C. Protein levels of vimentin were examined in shRNA (shVim), expressing stable MDA-MB 231 #3 and #4 clones for various shRNA sequences. shLuc was performed as a control. D. Cell proliferation was analyzed using an MTT assay. Each bar represents mean ± SEM of three independent experiments. *** indicates p < 0.001 vs. shLuc control. E. Representative images of a wound healing assay. Control cells (shLuc) and vimentin knockdown stable clones (shVim #3, #4) were seeded for 18 hours until a monolayer was formed. The monolayer was then scraped using tips. Images were produced after scraping for 0 (space between red dashed lines) and 12 hours (space between yellow dashed lines). F. The quantitative data for wound healing is shown in the right panel. The wound healing percentage was normalized to shLuc. G. Representative images of shLuc and shVim #3, #4 time lapse tracking for 3 hours. Cells were seeded at low density for 18 hours, and cell migration was recorded for 3 hours. The upper panels showed the original cell position at 0 hours, and the middle panels showed the cell position after live cell tracking for 3 hours. Each colored line indicates the migration trace of each cell. All cell migration traces are placed in the same center in the tracking images. Cells measured for each condition: shLuc: n = 9; shVim #3: n = 11; and shVim #4: n = 12. H. Quantitative data of directional migration. Upper panels indicate the distances and lower panels show the velocity of cell migration. Each bar represents mean ± SEM. * indicates p < 0.05, and *** indicates p < 0.001 vs. shLuc control.

