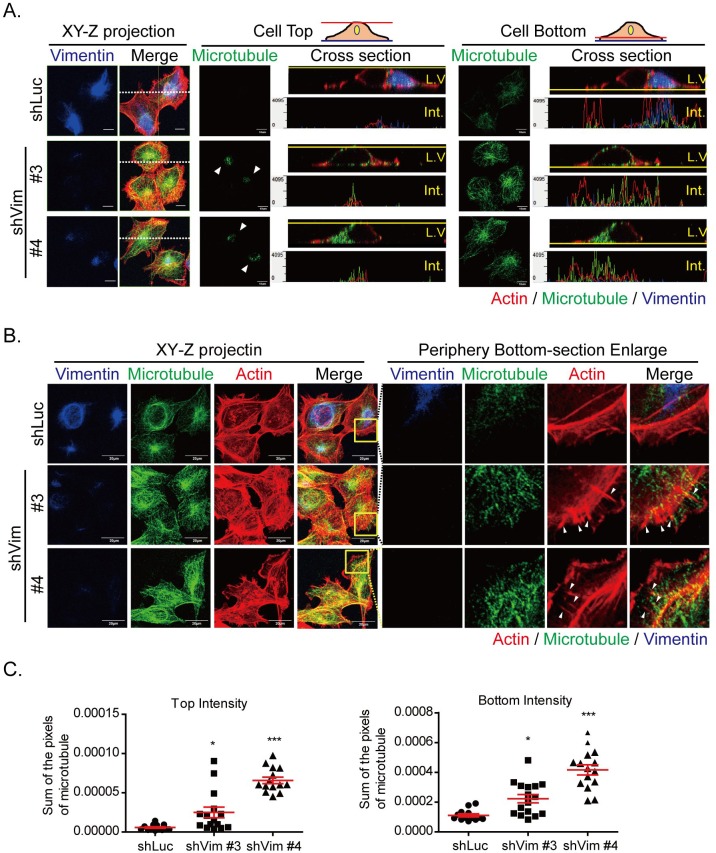
Figure 4. Microtubule is reoriented toward cell top and bottom in vimentin knockdown cells.
A. Photosectioning images of control (shLuc) and vimentin knockdown stable clones (shVim #3, #4) were produced using confocal microscopy. The images were separated into cell top and bottom for each clone. The left panels showed the XY-Z projection images of vimentin and merged images of three types of cytoskeleton. The horizontal white dash on the XY-Z projection images (left panels) indicates the LV section. Red: actin; green: microtubule; blue: vimentin. Scale bar: 10 μm. The fluorescence images were evaluated in each clone at cell top (middle panel) and cell bottom (right panel). In the middle panel, arrows indicate the microtubule staining at the cell top. The LV and section intensity at cell top or bottom are shown for each clone. B. Fluorescence images at the cell periphery of vimentin knockdown cells. Left panels indicate the XY-Z projected images of three types of cytoskeleton. Yellow boxes indicate the region of interest at the cell periphery. Scale bar: 20 μm. The regions of interest are enlarged, as indicated in the separate channels in the cell bottom sections. Red: actin; green: microtubule; blue: vimentin. Arrows indicate the actin spikes at the cell periphery. C. Quantitative results of the microtubule intensity of each clone at cell top (left panel) or bottom (right panel). * and *** indicate p < 0.05 and p < 0.001, respectively, compared with shLuc.

