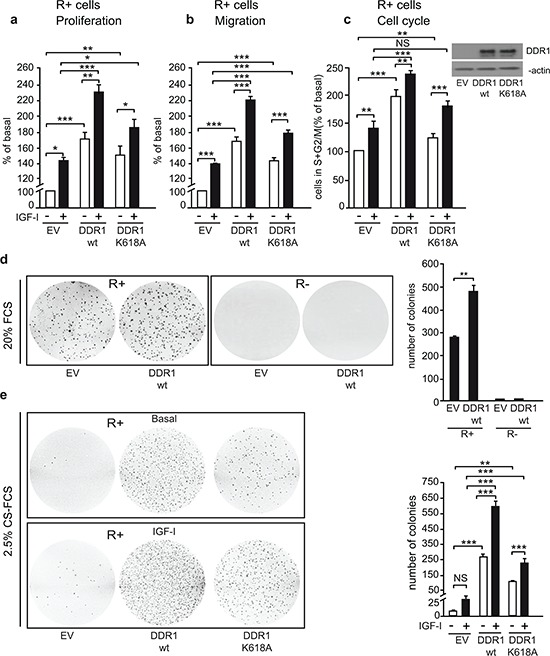
Figure 5. DDR1 expression regulates IGF-I biological effects in non-transformed cells.

(a) Cell proliferation after DDR1 overexpression. R+ mouse fibroblasts transfected with plasmids encoding either wild type DDR1 (DDR1/wt) or the DDR1/K618A mutant or the corresponding empty vector (EV), were plated in 96-well plates. 24 h after plating, cells were grown in medium containing 2.5% CS-FCS for 24 h and then incubated with or without IGF-I (10 nM) for additional 48 h. Cell viability was evaluated by MTT assay. Values are expressed as percentage of untreated (EV) transfected cells (basal) and represent the mean±SEM of three independent experiments performed in triplicate. *0.01 < p < 0.05; **0.001 < p < 0.01; ***p < 0.001; (untreated vs. IGF-I treated cells in EV, DDR1/wt and DDR1/K618A conditions; untreated EV transfected cells vs. untreated DDR1/wt or DDR1/K618A transfected cells; IGF-I treated EV transfected cells vs. IGF-I stimulated DDR1/wt or DDR1/K618A transfected cells). (b) Migration after DDR1 overexpression. R+ mouse fibroblasts transfected with plasmids encoding either the DDR1/wt or the DDR1/K618A mutant or the corresponding empty vector (EV) were grown in medium containing 0.1% of BSA for 24 h. Cells were then removed from plates with 0.01% trypsin and seeded on polycarbonate filters coated on the upper side with 25 μg/mL fibronectin. Cells were allowed to invade for 6 h in response to 10 nM IGF-I added to the lower chamber. Values are mean±SEM of three independent experiments done in duplicate and are expressed as percent of untreated (EV) transfected cells (basal). *0.01 < p < 0.05; **0.001 < p < 0.01; ***p < 0.001; (untreated vs. IGF-I treated cells in EV, DDR1/wt and DDR1/K618A conditions; untreated EV transfected cells vs. untreated DDR1/wt or DDR1/K618A transfected cells; IGF-I treated EV transfected cells vs. IGF-I stimulated DDR1/wt or DDR1/K618A transfected cells). (c) Cell cycle progression after DDR1 overexpression. R+ mouse fibroblasts transfected with plasmids encoding either the DDR1/wt or the DDR1/K618A mutant or the corresponding empty vector (EV) were grown in medium containing 0.1% of BSA for 24 h. Cells were then incubated with or without IGF-I (10 nM) for additional 48 h and analyzed for their cell-cycle profiles. Cell populations positive for propidium iodine staining were evaluated by FACS analysis, and G0/G1 and G2/M phases were scored. The graph shows the percentage of cells in S and G2/M phases. Values are expressed as percent of basal (untreated EV transfected cells) and are the mean±SEM of three independent experiments. NS, p > 0.05; **0.001 < p < 0.01; ***p < 0.001; (untreated vs. IGF-I treated cells in EV, DDR1/wt and DDR1/K618A conditions; untreated EV transfected cells vs. untreated DDR1/wt or DDR1/K618A transfected cells; IGF-I treated EV transfected cells vs. IGF-I stimulated DDR1/wt or DDR1/K618A transfected cells). (d) Colony formation after DDR1 overexpression. R− and R+ mouse fibroblasts stably transfected with plasmids encoding either the DDR1/wt or the corresponding empty vector (EV), were seeded in soft-agar, as described in Materials and Methods. Cells were plated in triplicate and grown in complete medium containing 20% FCS for 3 weeks. Colonies were stained with methyl thiazolyl tetrazolium (MTT) and then photographed. The histogram represents the mean number of colonies shown in (d) Error bars indicate SEM (n = 3 dishes). Data shown in (d) are from two independent experiments. **0.001 < p < 0.01; (EV vs. DDR1/wt). (e) Colony formation after DDR1 overexpression in response to IGF-I. R+ mouse fibroblasts stably transfected with plasmids encoding either the DDR1/wt or the DDR1/K618A mutant or the corresponding empty vector (EV), were seeded in soft-agar. Cells were plated in triplicate and cultured in serum free medium containing 2.5% CS-FCS for 3 weeks. Colonies were stained with methyl thiazolyl tetrazolium (MTT) and then photographed. The histogram represents the mean number of colonies shown in (E) Error bars indicate SEM (n = 3 dishes). NS, p > 0.05; **0.001 < p < 0.01; ***p < 0.001; (untreated vs. IGF-I treated cells in EV, DDR1/wt and DDR1/K618A conditions; untreated EV transfected cells vs. untreated DDR1/wt or DDR1/K618A transfected cells; IGF-I treated EV transfected cells vs. IGF-I stimulated DDR1/wt or DDR1/K618A transfected cells). (a–e) Statistical significance was calculated using one-way ANOVA followed by Bonferroni test.
