
Figure 6. DDR1 co-internalizes with IGF-IR and affects IGF-IR trafficking.
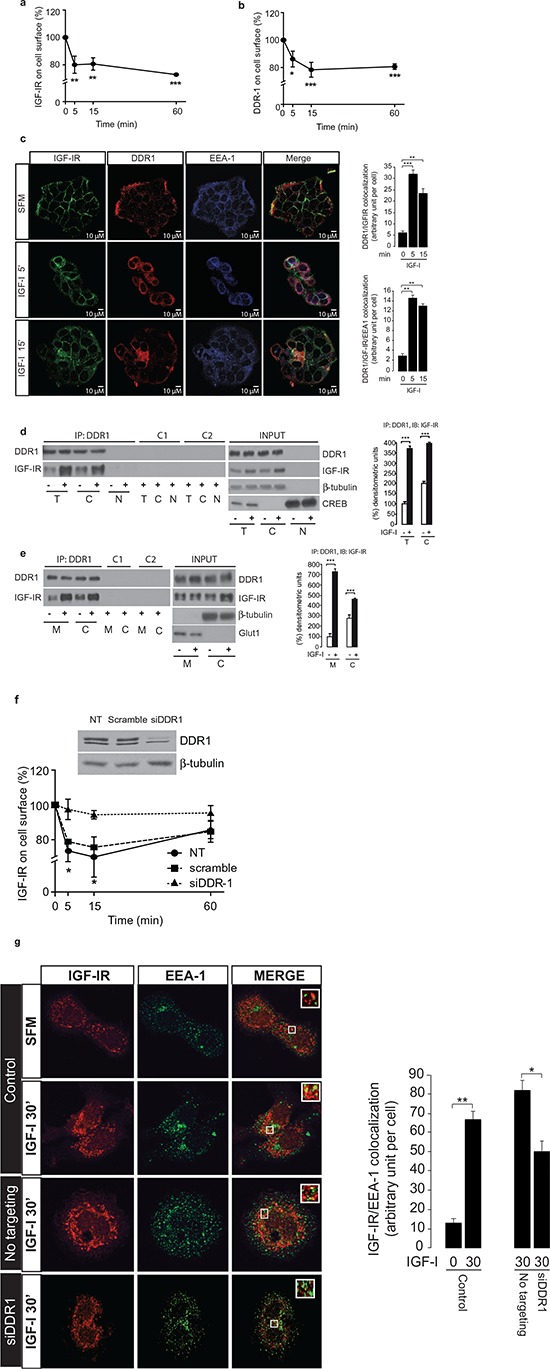
(a–b) ELISA analysis of IGF-IR and DDR1 internalization. MCF-7 cells were stimulated with IGF-I (10 nM) and the level of cell surface IGF-IR and DDR1 were determined by ELISA assay, as described in Methods, at different time points of stimulation. (c) IGF-IR and DDR1 co-localize to endosomes. MCF-7 cells were plated onto cover slips and serum-starved for 24 h. Cells were then stimulated with IGF-I (10 nM) for the indicated times. The triple staining indicating co-localization of the IGF-IR with DDR1 and EEA-1 was assessed by confocal microscopy. Colocalization index was calculated by ImageJ software. (d) and (e) IGF-I stimulation increases IGF-IR-DDR1 association at the cytoplasm (d) and membrane (e) level. MCF-7 cells were serum starved for 24 h and stimulated with 10 nM IGF-I for 5 min. Cells were then solubilized and total lysates (t), cytoplasmic (c) and membrane (m) fractions were immunoprecipitated with anti-DDR1 (C-20) (upper panels). Negative controls, including the use of an unrelated primary antibody (anti-HA, Y-11) or beads only are also shown. An aliquot of each fraction (input) was evaluated as control. Filters were probed with anti-DDR1 or anti-IGF-IR antibodies, as indicated. Anti β-tubulin, CREB and GLUT1 were used to respectively confirm cytoplasm, nuclear and membrane purification, respectively. A representative blot of four independent experiments is shown. Graphs represent the mean ± SEM of four independent experiments, where co-immunoprecipitated IGF-IR was normalized for the immunoprecipitated total DDR1 protein. ***p < 0.001 (basal vs. IGF-I), Student's t-test. (f) IGF-IR internalization is affected by DDR1 silencing. MCF-7 cells were transiently transfected with siRNA to DDR1 or scramble siRNAs. After 48 h, cells were stimulated with IGF-I (10 nM), and the level of cell surface IGF-IR was determined by ELISA. Untransfected cells are indicated as NT. DDR1 silencing was assessed by immunoblot analysis shown on the right of the ELISA graph. Data are the average ± SEM of three independent experiments. Statistical significance was determined using two-way ANOVA and Bonferroni post-test. *0.01 < p < 0.05; **0.001 < p < 0.01; ***p < 0.001. (g) IGF-IR localization to endosomes is affected by DDR1 silencing. MCF-7 cells were plated onto cover slips and transiently transfected with siRNA to DDR1 or scramble siRNAs. After 48 h, cells were stimulated with IGF-I (10 nM) for 30 min. Colocalization of the IGF-IR with EEA-1 was assessed by confocal microscopy. Insets represent enlarged views (3 ×) of boxed region. One hundred cells from at least 10 independent fields were examined. Images were collected on a Leica TCS-SP2 confocal microscope as described in Methods. Images were merged using Photoshop CS4. Pictures are representative of three independent experiments.