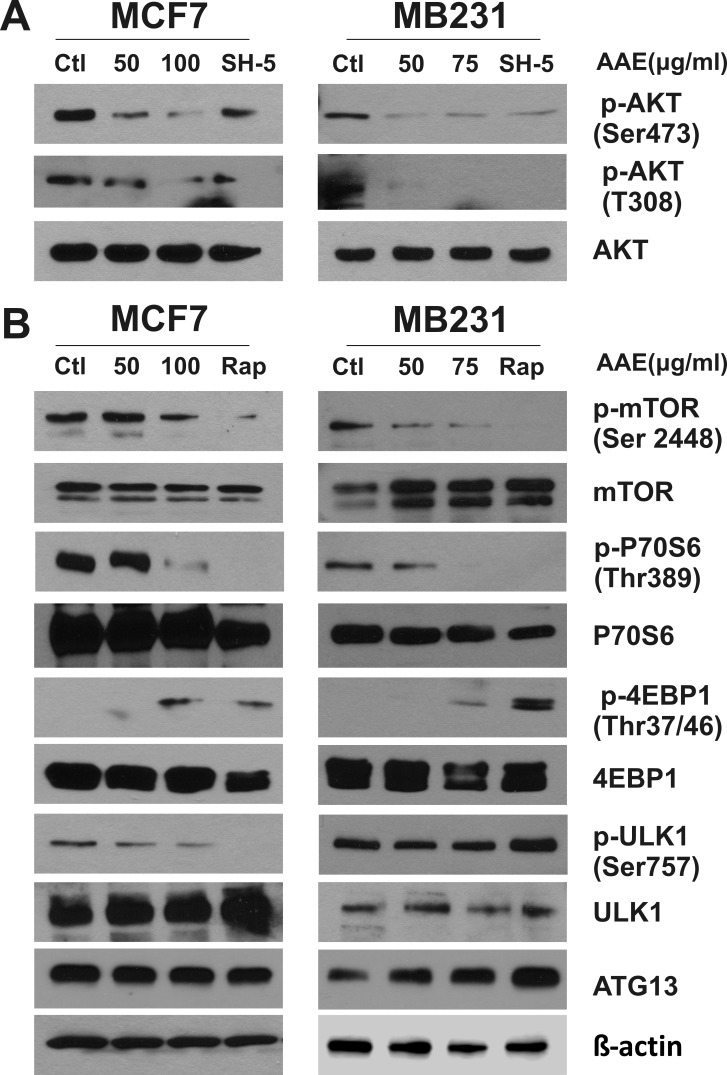
Figure 5. AAE down-regulates the activity of AKT-mTOR signaling pathway leading to autophagy.
BrCa cell cultures were treated with AAE for 24 h, cells were harvested and cell extracts were analyzed by immunoblotting. The levels of total Akt and mTOR, phospho-Akt, phospho-mTOR, total S6 ribosomal protein and 4E-BP1, phospho-S6 and phospho-4E-BP1, total ULK1 and phospho-ULK1, as well as ATG13 were detected by immunoblotting. Positive control used for panel A is AKT inhibitor, SH-5 at 20 μM; for panel B is mTOR inhibitor rapamycin at 25 nM. Levels of β-actin was used as a loading control. Since protein lysates from same experiment were analyzed for detecting signaling proteins, a single β-actin blot is shown at the bottom. All blots were repeated using new samples twice, with comparable results.

