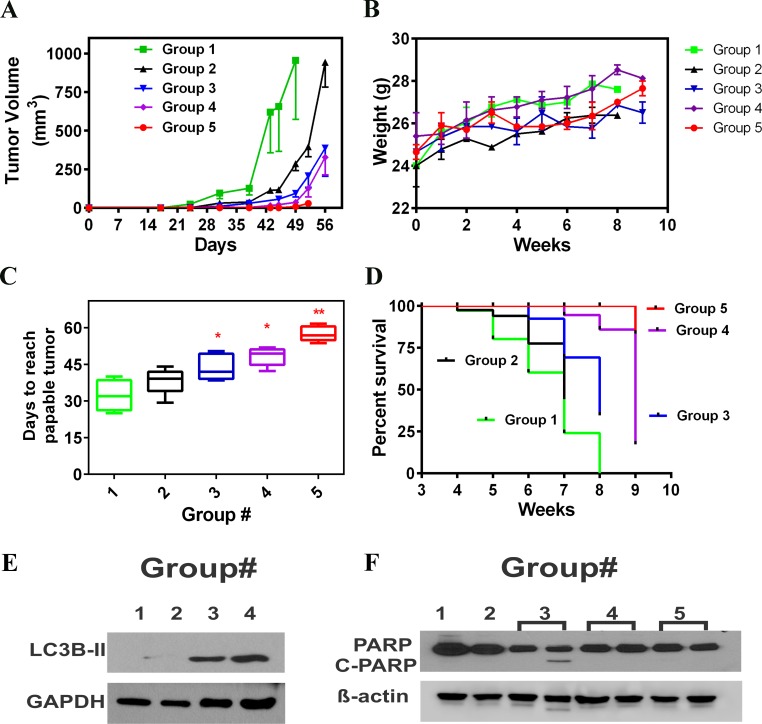
Figure 7. AAE inhibits MDA-MB231 tumors in vivo.
A. Tumor growth kinetics of MB231 tumors in mice in all 5 treatment groups: Groups:(1) Vehicle, (2) Daily AAE gavage after tumor cell injections, (3) AAE pre-gavage plus AAE gavage after tumor cell injection, (4) Tumors originated from cells pretreated with AAE but no AAE gavage after in vivo injection and (5) Mice injected with pre-exposed cells and then gavaged with AAE daily. (Vertical bars: SD, one sided). B. Mean body weight (g) of mice in vehicle and various treatment groups, measured weekly. C. Days needed for tumor size to reach 40 mm3 for different treatment groups. Description for different groups is shown in Table 1. Non-linear regression fit was generated using Graph Pad Prism for each mice and the days need to reach 40 mm3 was calculated using equations accordingly, symbols shown represent mean time needed (vertical bars: SD, n = 5-7). D. Survival of mice from all five groups. Data selected from week-3 to week-9 (end point of experiment was week 8, except in Group 5 where were euthanized at the end of 9 weeks because, 4 out of 6 mice (76 %) did not have palpable tumor. Time of event is tumor reaching 100 mm3 (0.1 cc) in volume. E. Increased levels of autophagy were detected in tumor samples of AAE treated mice. Protein was extracted using RIPA lysis buffer. Immunoblotting analysis was done against LC3B antibody. GAPDH was used as a loading control. F. Lack of apoptosis (cleaved PARP) in tumor tissues from all five groups. Baring one sample in Group 3, cleaved PARP was not detected in any tumor samples.

