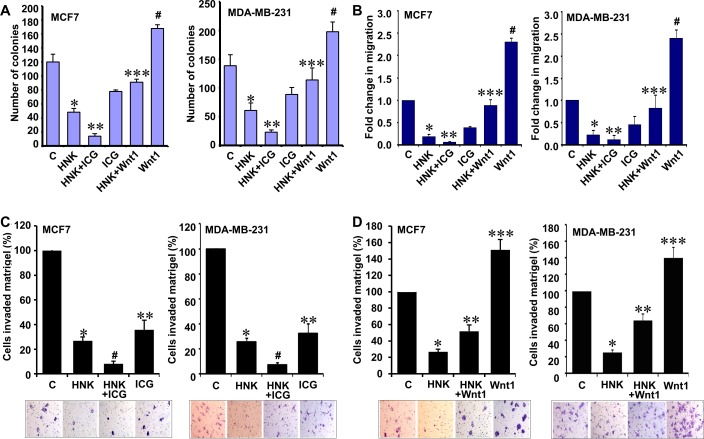
Figure 5. Inhibition of β-catenin potentiates while Wnt1 treatment reduces the effect of HNK on invasion and migration potential of breast cancer cells.
A. Clonogenicity of breast cancer cells treated with 5 μM HNK, ICG001 or Wnt1 alone and in combination as indicated. Vehicle-treated cells are denoted with the letter “C”. *, P < 0.001, compared with untreated controls; **, P < 0.005, compared to HNK-treated cells; ***, P < 0.001, compared with HNK-treated controls; #, P < 0.005, compared to untreated cells. B. MCF7 and MDA-MB-231 cells were subjected to spheroid-migration assay. Culture media were replaced with media containing 5 μM HNK, ICG001, Wnt1 alone and in combination as indicated. The spheroids were photographed at 48h-post treatment. The results (fold-change in migration) shown are representative of three independent experiments performed in triplicates. *, P < 0.005, compared with untreated controls; **, P < 0.005, compared to HNK-treated cells; ***, P < 0.001, compared with HNK-treated controls; #, P < 0.001, compared to untreated cells. C. Matrigel invasion assay of breast cancer cells treated with 5 μM HNK and ICG001 alone and in combination as indicated for 24 hours. The number of cells that invaded through the Matrigel was counted in five different regions. The slides were blinded to remove counting bias. Representative images are shown. The results show mean of three independent experiments performed in triplicates. *, P < 0.005, compared with untreated controls; #, P < 0.001, compared to HNK-treated cells; **, P < 0.001, compared with untreated controls. D. Matrigel invasion assay of breast cancer cells treated with 5 μM HNK and Wnt1 alone and in combination as indicated for 24 hours. Representative images are shown. The results show mean of three independent experiments performed in triplicates. *, P < 0.001, compared with untreated controls; **, P < 0.001, compared to HNK-treated cells; ***, P < 0.001, compared with untreated controls. Vehicle-treated cells are denoted with the letter “C”.

