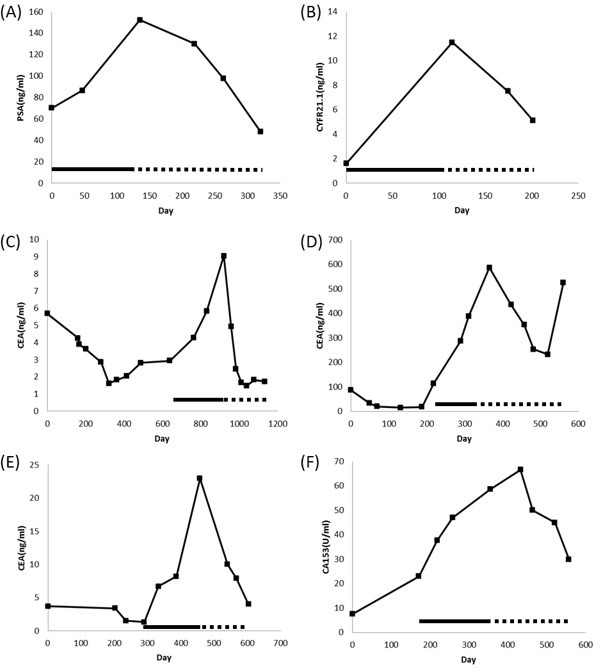
Figure 2. Representative plots of serum tumor markers versus time.

(A) patient #1; (B) patient #6; (C) patient #9; (D) patient #11; (E) patient #14; (F) patient #16.—Control metronomic chemotherapy; …… Rapa/HCQ + metronomic chemotherapy.

(A) patient #1; (B) patient #6; (C) patient #9; (D) patient #11; (E) patient #14; (F) patient #16.—Control metronomic chemotherapy; …… Rapa/HCQ + metronomic chemotherapy.