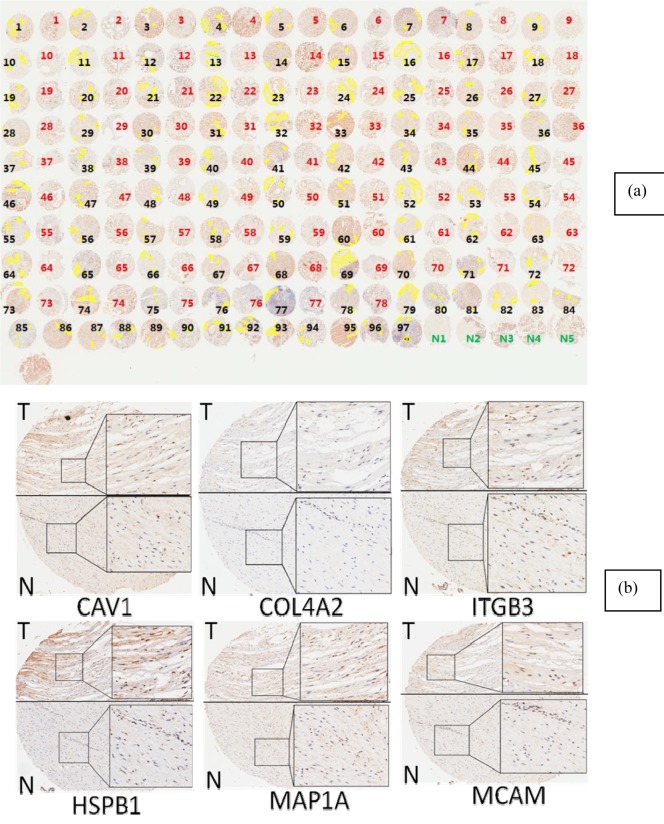
Figure 2.
a. The stroma component selected for differential expression analysis. The images presented in the figure were obtained from IHC analysis of MCAM. Samples labeled with black/red represent, respectively, tumor-bearing and tumor-adjacent tissues from patients' prostate glands; samples labelled with green are prostate tissue from normal subjects. b. Representative figures obtained from IHC analysis of CAV1, COL4A2, ITGB3, HSPB1, MAP1A and MCAM. The samples labeled with T represent tumor-bearing/tumor-adjacent stroma area from patients' prostate glands; the samples labeled with N represent tumor-adjacent stroma (tumor free) area from the same patients' prostate glands.

