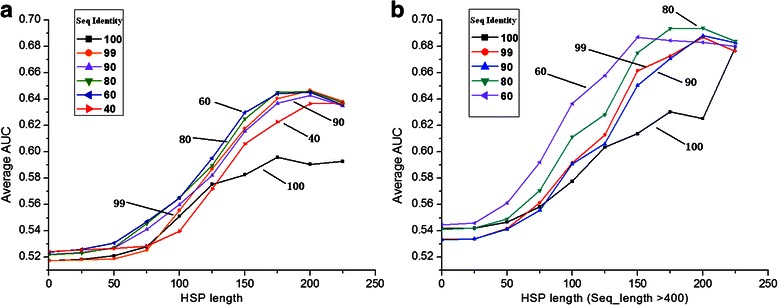
Fig. 4.

Interface prediction depends on HSP length and % ID filtering. a Average AUC with the increasing HSP-length from 0 to 225. Each line shows one dataset with identity cut-off. b Same as a but with minimal sequence length 400. The AUC with the dataset filtering at 40 % is not shown because a limited number of groups remain. The chart which shows the full set of sequence identity cut-offs can be seen in Additional file 1: Figure S2. The dataset used here is Test-set 1
