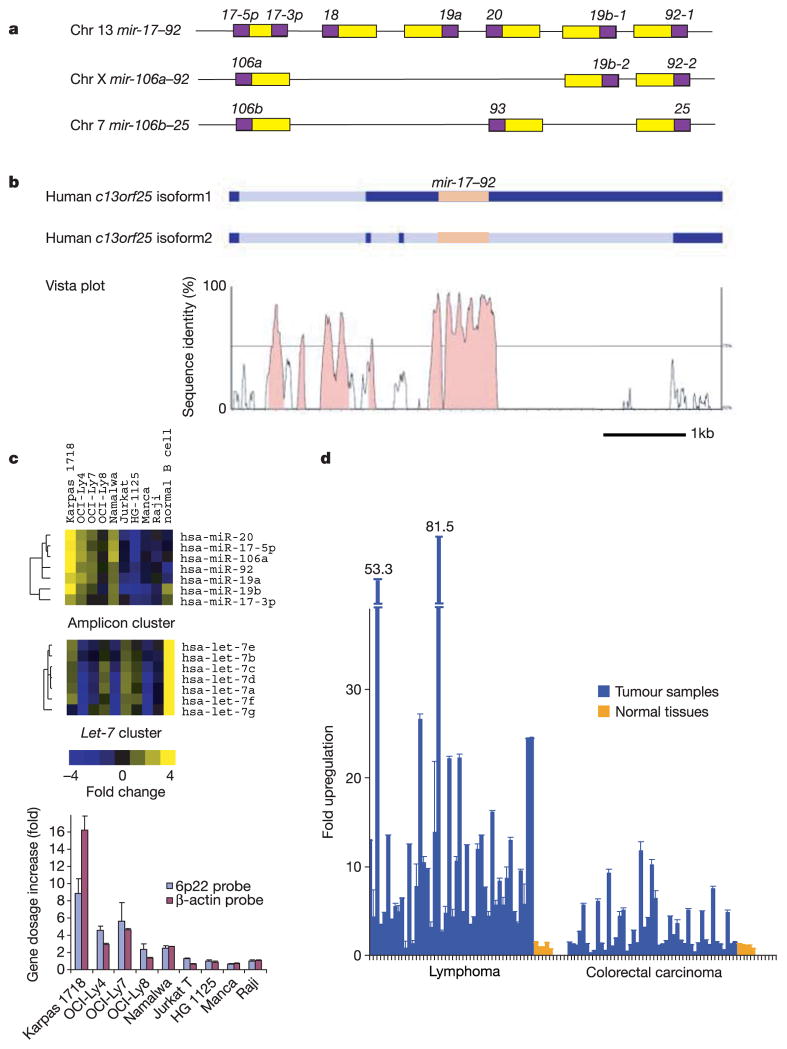
Figure 1. The mir-17–92 cluster shows increased expression in B-cell lymphoma samples and cell lines.
a, Genomic organization of three polycistronic miRNA clusters is shown. There are five paralogous groups located in three homologous clusters (mir-17–92, mir-106a–92 and mir-106b–25) with a conserved order: miR-17-5p/miR-106a/miR-106b; miR-18; miR-19a/miR-19b-1/miR-19b-2; miR-20/miR-93; and miR-92-1/miR-92-2/miR-25 (yellow boxes, pre-miRNAs; purple boxes, mature miRNAs). b, The level of conservation between human and mouse homologues is represented using an mVista plot28. Two alternative isoforms have been detected for the human gene, and these are shown schematically1 (dark blue, exons; light blue, introns; orange, the mir-17–92 cluster). c, MicroRNA expression levels in cell lines carrying the 13q31-q32 amplicon (including Karpas 1718, OCI-Ly4 and OCI-Ly7) were compared to those in leukaemia and lymphoma cell lines lacking this genetic lesion, and to normal B-cells isolated from cortical blood (top panel). We included in this analysis the OCI-Ly8 cell line, which has previously been identified as a cell line carrying the 13q31-32 amplicon, but showed no gene dosage increase at the c13orf25 locus in our study. Normalized one-channel measurements for 191 human miRNAs were hierarchically clustered for all miRNA genes represented on the array. An excerpt of the data is shown, and the full cluster analysis is presented in Supplementary Fig. 1. The expression map node that correlates with the amplification is shown. The let-7 cluster node is also shown for comparison (middle panel). In the cell lines examined, expression levels of the mature microRNAs from the mir-17–92 polycistron correlate with the copy number at the mir-17–92 locus (bottom panel). d, The level of mir-17–92 pri-miRNA was determined by real-time quantitative PCR in 46 lymphomas and 47 colorectal carcinomas, and compared to levels found in corresponding normal tissues from five individuals. In c and d, error bars indicate standard deviation (s.d.).

