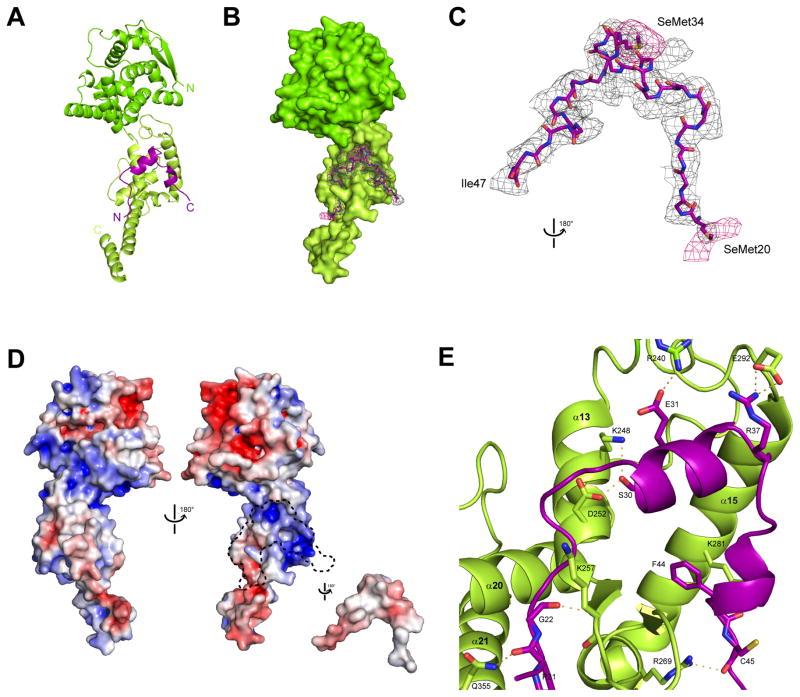
Figure 3. The complex structure of ΔNPNTD and NPBP reveals extensive intermolecular interactions, related to Figure S2 and S4.
(A) The 1:1 complex of NPBP/ΔNPNTD (mol C/mol G). The ΔNPNTD head lobe (residues 37–146, dark green) also contains a flexible hinge region (residues 147–239) that connects to the foot lobe (residues 240–285, light green). The VP35 NPBP interacts with the binding surface formed exclusively by the ΔNPNTD foot lobe. (B) Surface representation of ΔNPNTD with a 1.0 sigma electron density (sigmaA weighted Fo–Fc) mesh shown for NPBP. (C) An anomalous difference map was calculated from data collected at the selenium edge on a crystal of SeMet derivatized ΔNPNTD bound to NPBP synthesized with Se-Met instead of Met. Relative orientation of the figure as shown is 180° rotated from (B). The anomalous map (pink) is contoured at 3.0 sigma to show the position of selenium atoms in the methionine residues within the NPBP structure (Cα backbone shown in stick representation). Residues SeMet 20 and SeMet 34 are shown in stick representation. (D) Analysis of the NPBP/ΔNPNTD complex shows surface complementarity and extensive hydrophobic interactions among residues at the interface. Electrostatic surface representations of the NPBP/ΔNPNTD complex with (left) and without NPBP (right). Red, white, and blue colors represent negative, neutral, and positive electrostatic potential, respectively (−10 to +10 kBT e−1). Arrowhead denotes potential RNA binding site. A dotted outline highlights the region where the VP35 NPBP binds to ΔNPNTD. (E) Residue specific contacts between ΔNPNTD and NPBP are highlighted by the amino acid sidechains shown within 5 Å of NPBP.

