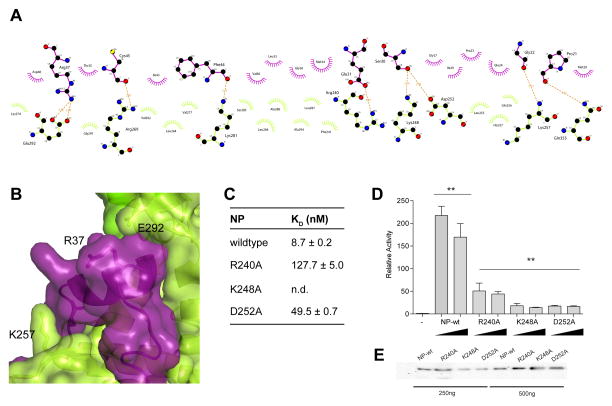
Figure 4. Mutational analysis validates the NPBP binding site on NP.
(A) Non-bonded contacts drive NPBP/ΔNPNTD binding. LigPlot+ diagram showing extensive hydrophobic and hydrogen bond interactions between ΔNPNTD and NPBP. Protein side chains are shown as ball and sticks. Hydrogen bonds are shown as orange dotted lines. Non-bonded contacts are shown as spoked arcs. (B) Surface and ribbon representation highlighting the interaction between NPBP (purple) and the foot lobe of ΔNPNTD (light green). VP35 NPBP residues Glu24 and Arg37 and NP residues Lys257 and Glu292 are shown in stick representation. (C) Summary of ITC binding measurements between ΔNPNTD mutants and NPBP reveal that residues R240, K248, and D252 are involved in NPBP/ΔNPNTD complex interactions. n.d., not determined. (D) Impact of the NP mutants was evaluated by the MG assay. Ability of either wildtype or mutant NP proteins to promote MG activity were tested and plotted as MG activity relative to no NP control. The p values are determined by student t-test. ** p< 0.001. Representative western blots to show similar levels of NP protein expression. (E) Representative western blots for NP proteins used in (D) at 250 and 500 ng plasmid transfections.

