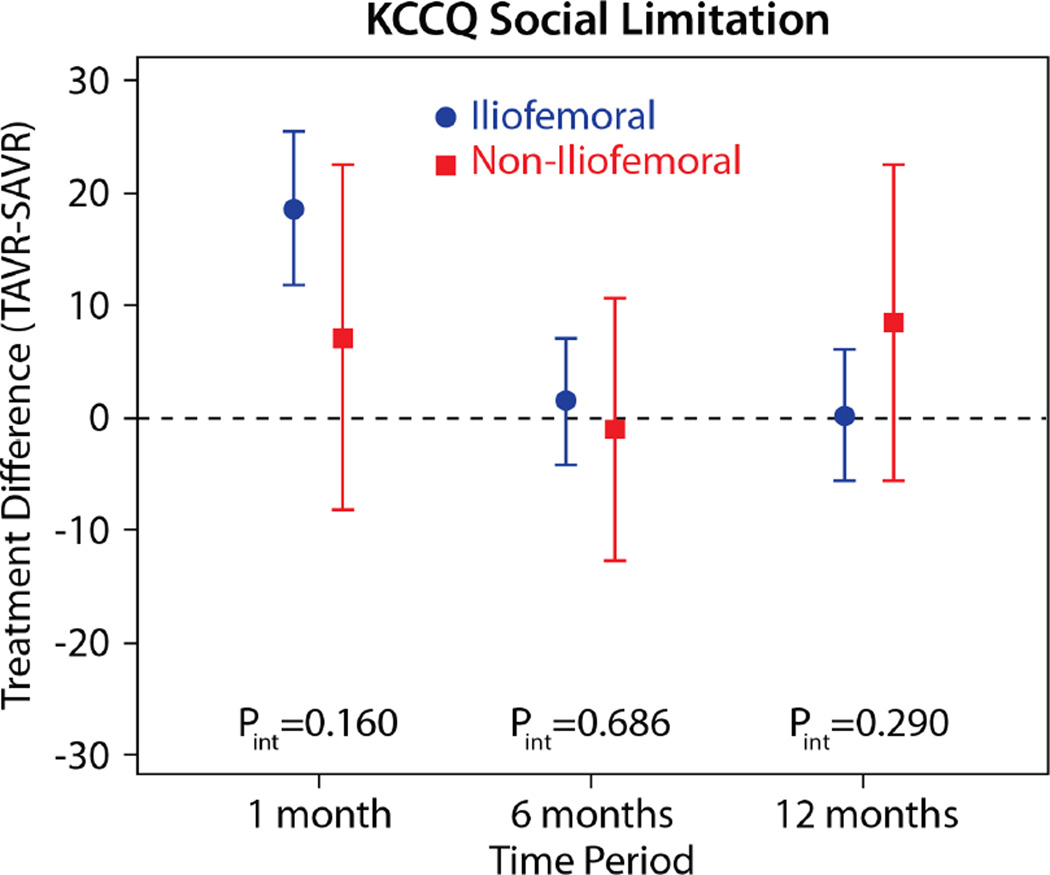
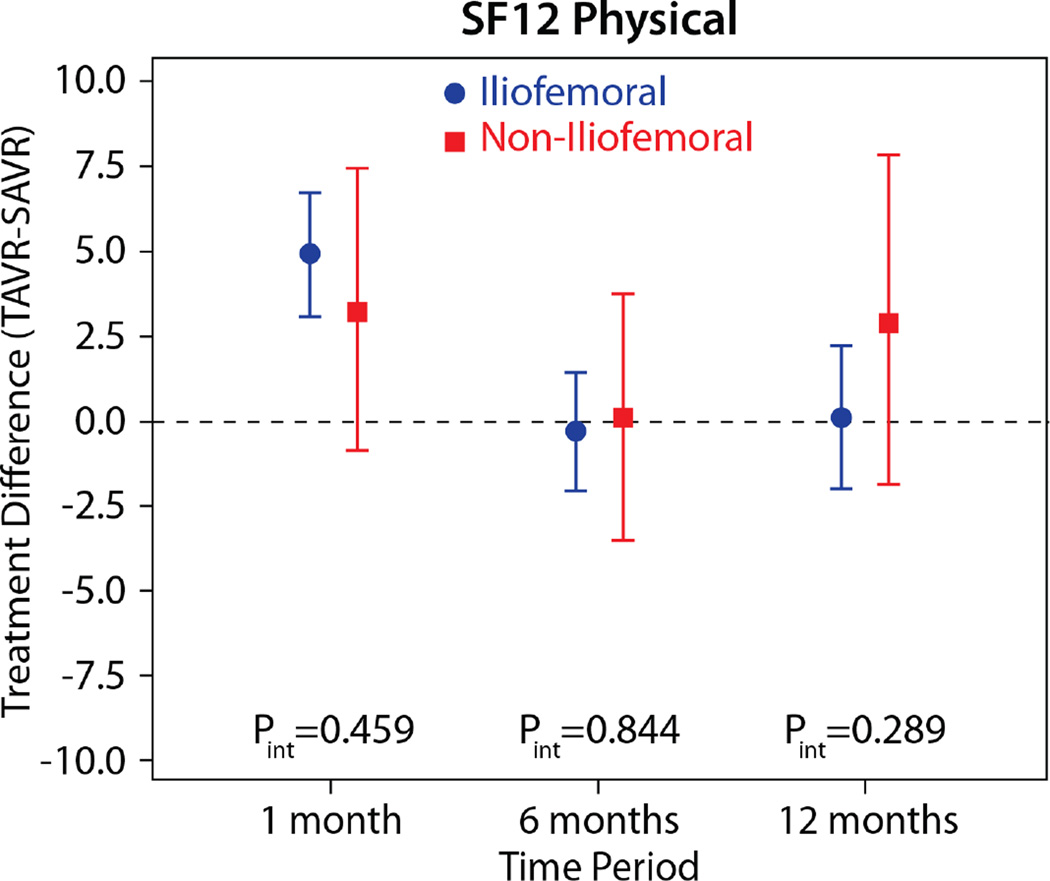
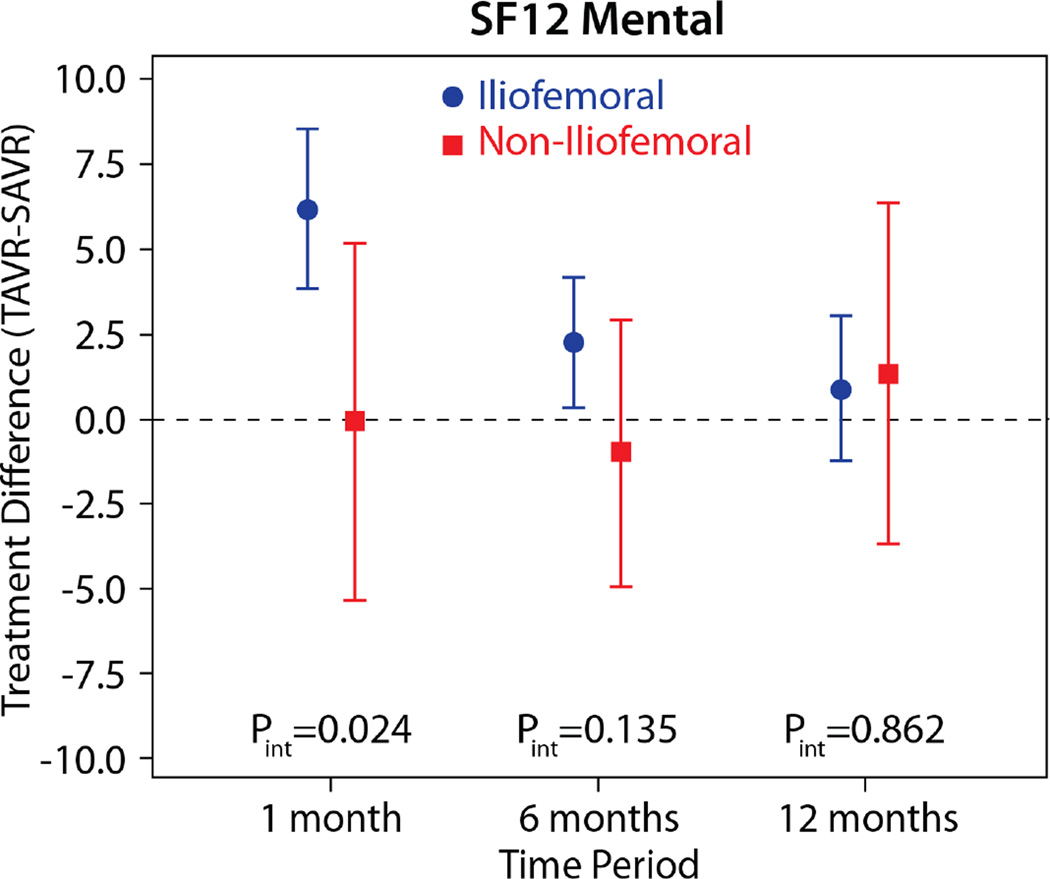
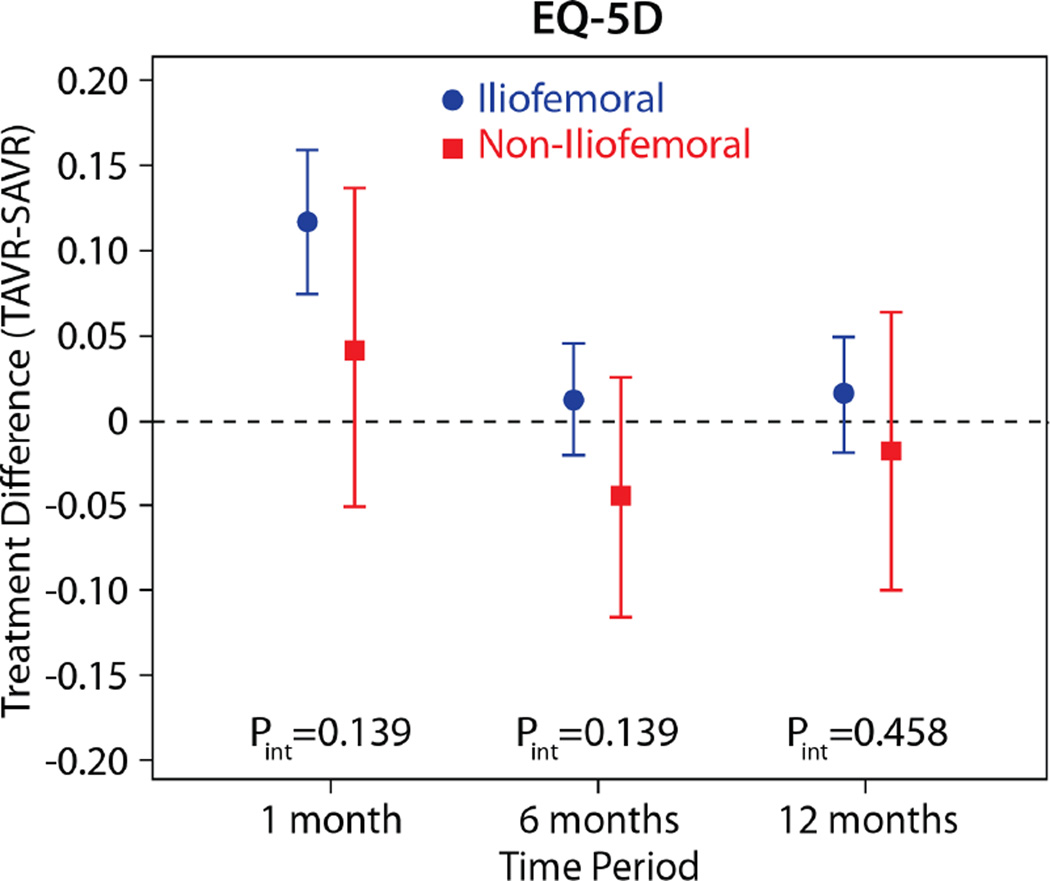
Figure 2. Adjusted between group differences in generic health status between TAVR and AVR, based on longitudinal growth curve models.
Results are reported separately for the iliofemoral (blue circles) and non-iliofemoral (red squares). Error bars denote 95% confidence intervals. P values are for the interaction between treatment group and access site at each time point.


