
Figure 3.
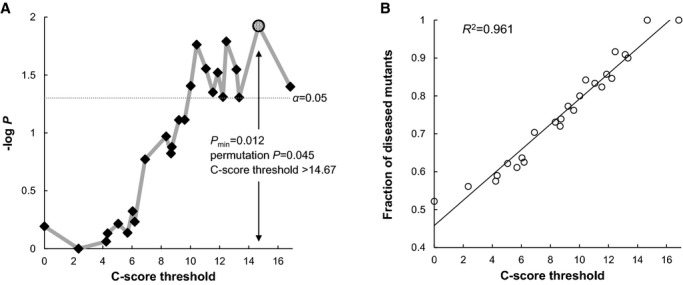
Variable threshold test using combined annotation dependent depletion for rare missense variants in RNF213. A, −log10 P values for burden tests were plotted against C-score thresholds (diamonds). The empirical threshold was given if the P value was minimized (Pmin; shaded circle). Corrections for multiple comparisons were achieved by 1000 permutations on phenotypes. B, Fractions of diseased mutants per total mutants were plotted against C-score thresholds (open circles). The black line represents the least-squares regression line.