
Figure 4.
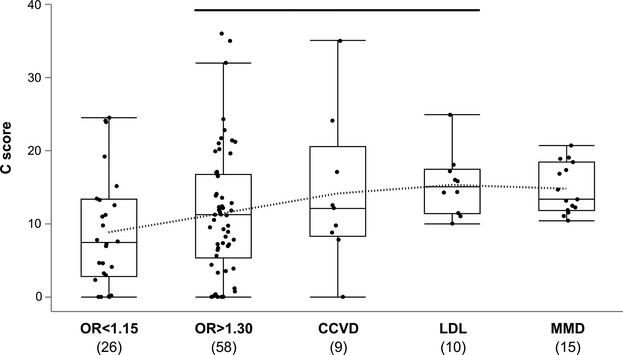
Boxplots of C-scores for missense SNPs in the GWAS catalog25 and 15 candidate variants for MMD. OR <1.15 represents binary trait loci with ORs in the bottom quartile; OR>1.3 indicates binary trait loci with ORs above median. The dotted line connects each average value. The black line over bars indicates no significant differences from the MMD candidate variants (Steel’s test). CCVD indicates cardiocerebrovascular disease loci; GWAS, genomewide association study; LDL, quantitative trait loci associated with serum low-density lipoprotein cholesterol level; MMD, moyamoya disease; OR, odds ratio; SNP, single-nucleotide polymorphism.