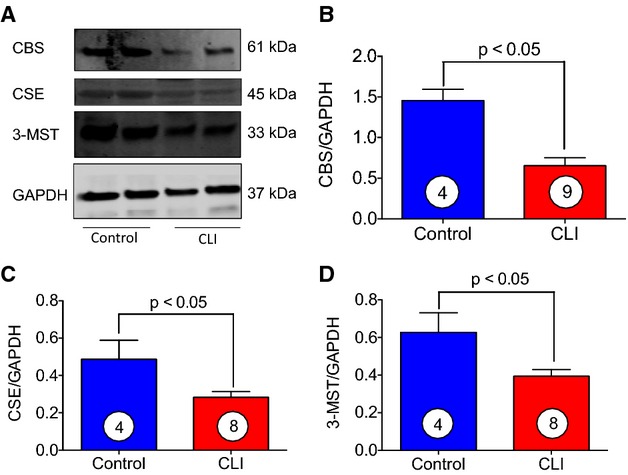
Figure 3.

Levels of CBS, CSE, and 3-MST in skeletal muscle of control and CLI patients. A, Representative immunoblots of CBS, CSE, and 3-MST from either skeletal muscle of CLI patients or healthy controls. B through D, Represent relative intensity of immunoblots in (A). Circle with number inside bar denotes number of patients per group. CBS indicates cystathionine β-synthase; CLI, critical limb ischemia; CSE, cystathionine γ-lyase; 3-MST, 3-mercaptopyruvate sulfurtransferase.
