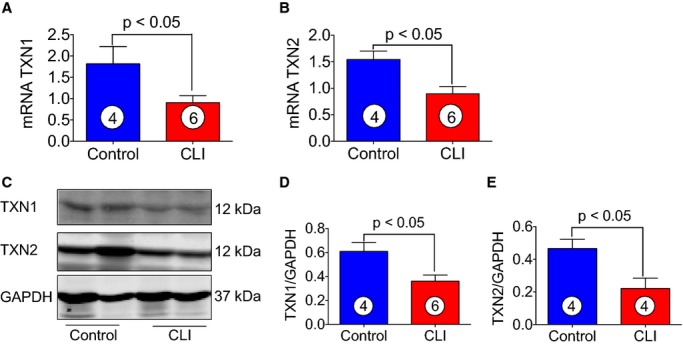
Figure 8.

Levels of TXN1 and 2 in skeletal muscle of healthy controls and CLI patients. A and B, Represent the mRNA expression of TXN1 and TXN2, respectively, in the skeletal muscle of control and CLI patients. C, Immunoblots of TXN1 and TXN2 for the protein samples obtained from skeletal muscle tissues from CLI patients and controls. D and E, Quantitation of immunoblots in (C). Circle with number inside bar denotes number of patients per group. CLI indicates critical limb ischemia; TXN, thioredoxin.
