
Figure 1.
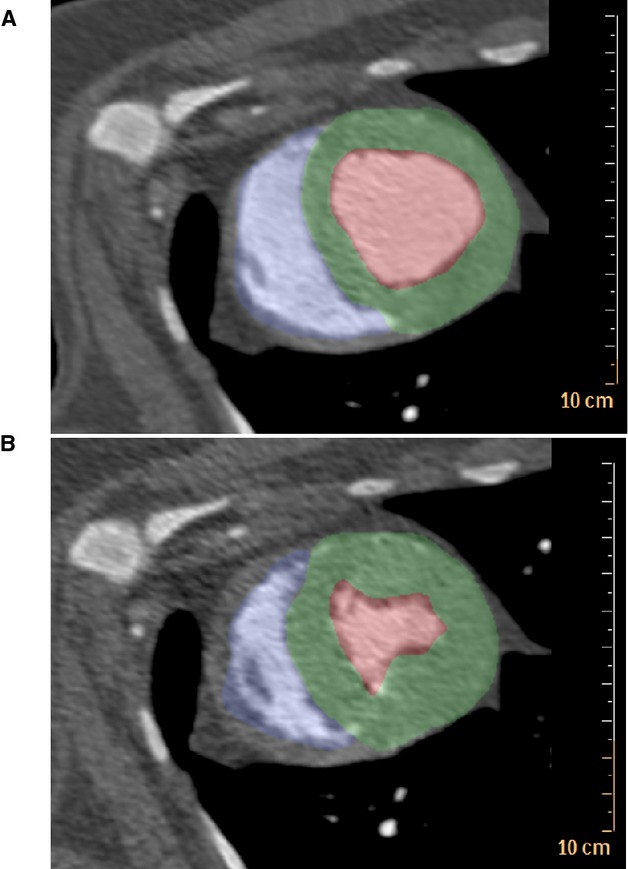
ECG-gated dynamic contrast-enhanced computed tomography allowed for quantification of end-diastolic volume and end-systolic volume to assess cardiac function in Ossabaw swine with metabolic syndrome. A, Diastole. B, Systole. Blue indicates the right ventricular cavity. Green indicates the left ventricle; Red indicates the left ventricular cavity.