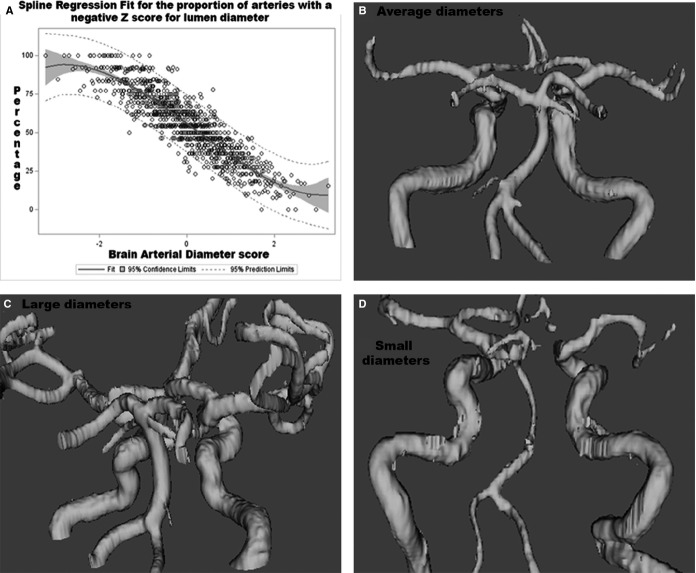
Figure 1.
A, The BAR score represents a construct that discloses in a single number the tendency of an individual to have small or large arteries. As the score gets smaller, the proportion of arteries with small lumina increases. In the opposite direction, as the BAR score increases, so does the proportion of arteries with larger diameters respective to other NOMAS participants. Those in the middle represent a combination of the above. B and C, Tridimensional reconstruction of the cerebral vasculature showing examples of individuals with average diameters (B), small diameters (C), and large diameters (D) defined categorically for this study. BAR indicates brain arterial remodeling; NOMAS, Northern Manhattan Study.

