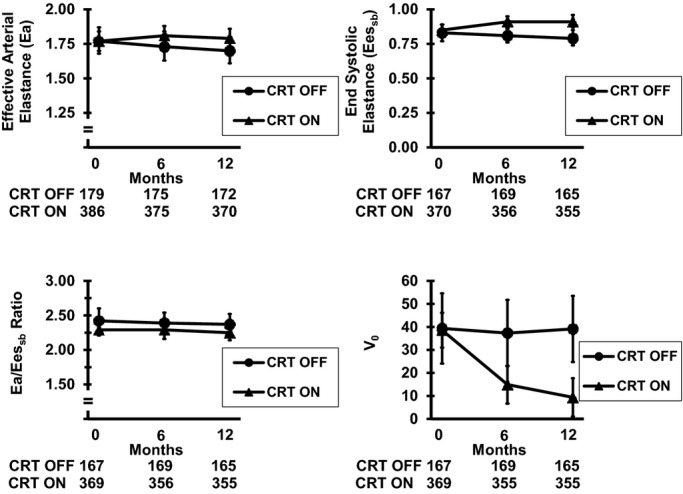
Figure 2.

Changes in echocardiography parameters over 6 and 12 months. Mean values along with 95% CIs are presented according to CRT ON or CRT OFF for Ea, Eessb, Ea/Eessb, and V0. The numbers below each figure represent the number of participants in each subgroup (CRT OFF or CRT ON). The most pronounced changes were observed in V0. CRT indicates cardiac resynchronization therapy; CRT OFF, control group; CRT ON, active group; Ea, effective arterial elastance; Eessb, single beat–derived end-systolic elastance; V0, volume intercept.
