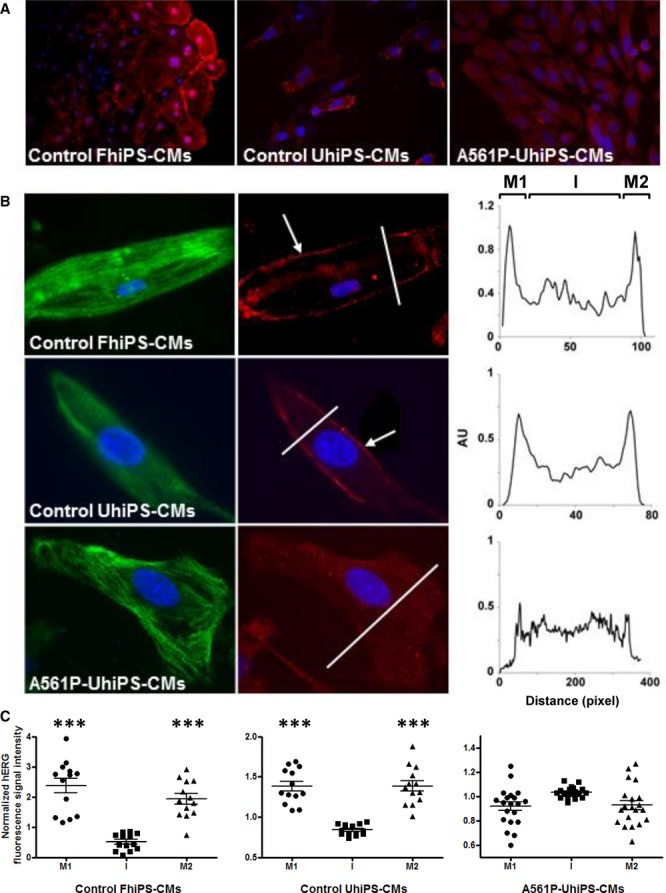
Figure 3.

HERG trafficking defect in A561P-UhiPS CMs. A, HERG protein localization (red) after cardiac differentiation of hiPS cells, highlighting the low membrane expression of HERG in A561P-UhiPS CMs relative to intracellular signal (magnification ×20) compared with both controls (control FhiPS-CMs and UhiPS-CMs). B, (left) Specific cellular localization of HERG (red) in cardiomyocytes with counterstaining for troponin I (green, magnification ×65); (right) surface plots of HERG staining in each cell at the level of the line. C, Statistical analysis of surface plots of HERG fluorescence intensity signal. Control FhiPS-CMs, n=12; control UhiPS-CMs, n=12; A561P-UhiPS CMs, n=20. The surface plot was arbitrarily segmented in 3 different areas: the first and last 15% of the surface plot, corresponding to plasma membrane (M1 and M2, as described in Figure 3B), and the remaining intermediate 70% of the surface plot, corresponding to the intracellular compartments. For each of these areas in each cell, the HERG fluorescence intensity values were averaged and normalized to the average cell HERG fluorescence intensity signal. Paired t tests were performed between membrane and intracellular signals. ***P<0.001, for membrane vs intracellular fluorescence intensity signal. CM indicates cardiomyocytes; FhiPS, foreskin fibroblast–derived human induced pluripotent stem cells; I, intracellular compartments; UhiPS, urine-derived human induced pluripotent stem cells.
