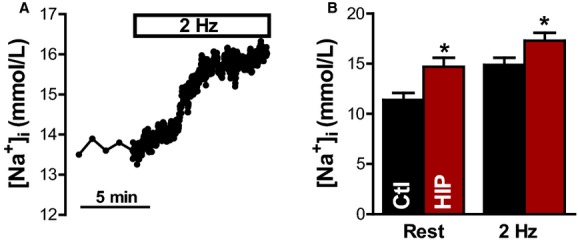
Figure 2.

[Na+]i is elevated in myocytes from diabetic HIP rats vs WT. A, Representative example of [Na+]i measurements in a HIP rat myocyte. [Na+]i was first measured at rest, then cells were electrically stimulated at 2 Hz. B, Mean steady-state [Na+]i at rest and during electrical stimulation in myocytes from HIP (9 cells from 5 rats) and WT rats (7 myocytes from 5 animals). Ctl indicates control; HIP, model of late-onset T2D; [Na+]i, intracellular Na+ concentration; WT, wild-type. *P<0.05
