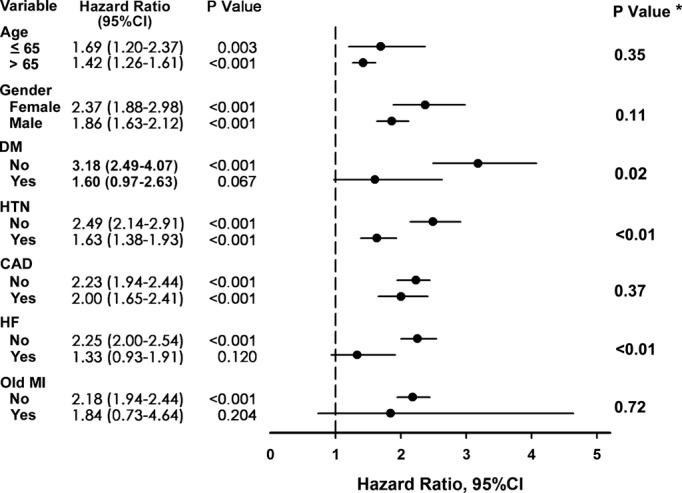
Figure 3.

Forest plot for subgroup analysis for all-cause mortality. Hazard ratio of PAC >76 beats per day group compared with PAC ≤76 beats per day group in different subgroups of patients with individual risk factors. *P value for the PACs burden by each stratification variables interaction. CAD indicates coronary artery disease; DM, diabetes mellitus; HF, heart failure; HTN, hypertension; MI, myocardial infarction; PAC, premature atrial complex.
