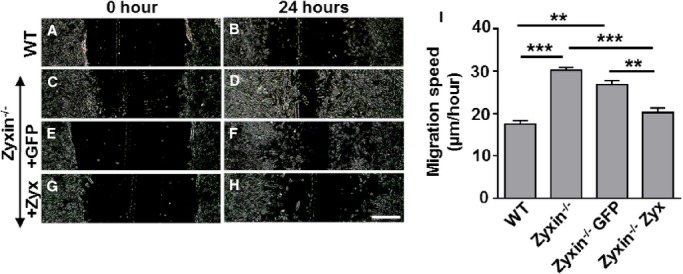
Figure 5.

Zyxin−/− VSMCs are primed for migration in a 2D scratch assay. A through H, Representative images of the migration of WT and zyxin−/− VSMCs into a 2D scratch after 24 hours. Scale bar represents 500 μm. The sharpness and contrast of the images were adjusted to the same extent to clearly represent the migration front. I, Quantitative analysis of migration speed of the cells. The distance traveled by the cell front was divided by the time period to get the 2D migration speed. **P<0.01, ***P<0.001 as indicated. For all groups, n=5 except for Zyxin−/− GFP and Zyxin−/−Zyx where n=3. 2D indicates 2-dimensional; GFP, green fluorescent protein; VSMCs, vascular smooth muscle cells; WT, wild type.
