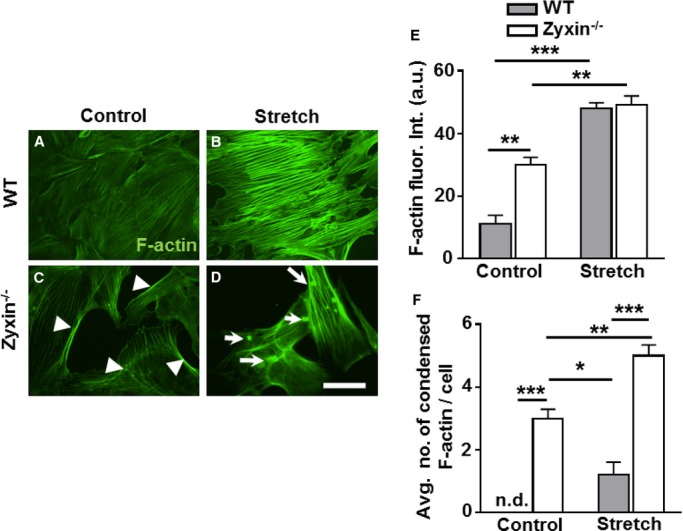
Figure 10.

Zyxin−/− stretched VSMCs display a disarray of F-actin stress fibers. A through D, F-actin stress fibers in control and stretched VSMCs (15% cyclic elongation for 1 hour) were stained with Alexa fluor 488-labeled phalloidin (white). Scale bar represents 50 μm. E, Quantification of F-actin fluorescence intensity in control and stretched VSMCs with zyxin-deficient VSMCs having prominent F-actin staining along the edges of the cells (white arrowheads in Figure 10C). **P<0.01, ***P<0.001 as indicated, n=3 for each group. F, The average number of condensed F-actin deposits (white arrows, D) within the cells was quantified. *P<0.05, **P<0.01 and ***P<0.001 as indicated, n.d. indicates not detectable, n=3 for each group. VSMCs indicates vascular smooth muscle cells; WT, wild type.
