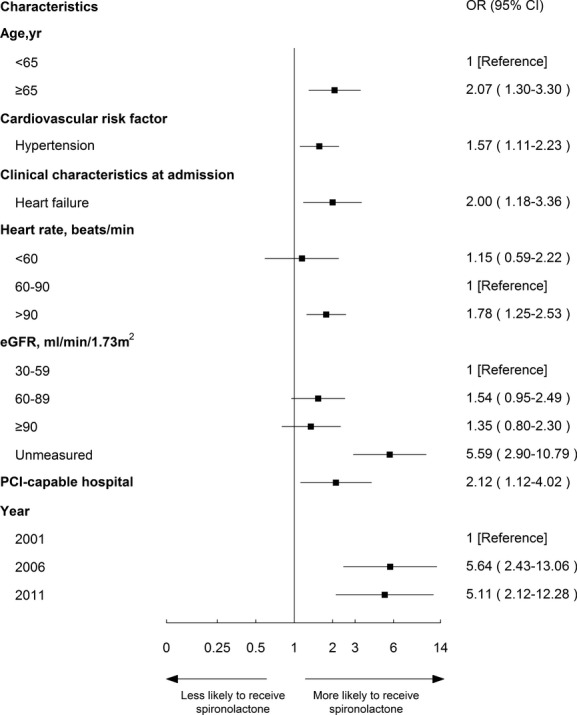
Figure 4.

Factors associated with spironolactone therapy among “ideal” patients in the multivariable model. Variables associated with spironolactone therapy among ideal patients are shown along the vertical axis. The adjusted odds ratio of 1 shows no difference to receive spironolactone therapy among ideal patients. Each dot represents the point estimate of the effect of that variable in the model; the line shows the 95% confidence interval (CI). eGFR indicates estimated glomerular filtration rate; OR, odds ratio; PCI, percutaneous coronary intervention.
