
Figure 2.
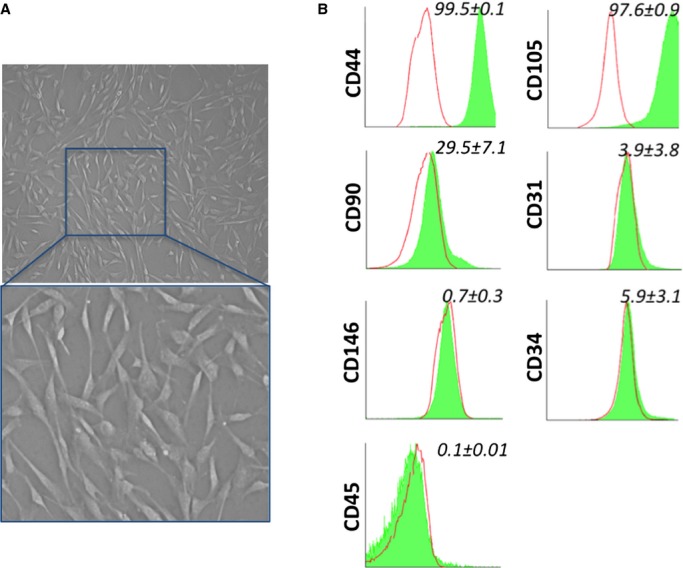
In vitro characterization of cardiac pericytes (CPs). (A) Representative phase-contrast optical image of CPs in culture (in the upper image magnification is ×200). (B) Representative flow cytometry histograms of cultured CPs at P5. Isotype control IgG staining profiles are shown by the red border line histograms, while specific antibody staining profiles are shown by full green histograms. Data are expressed as means±SEM (n=8 CPs).