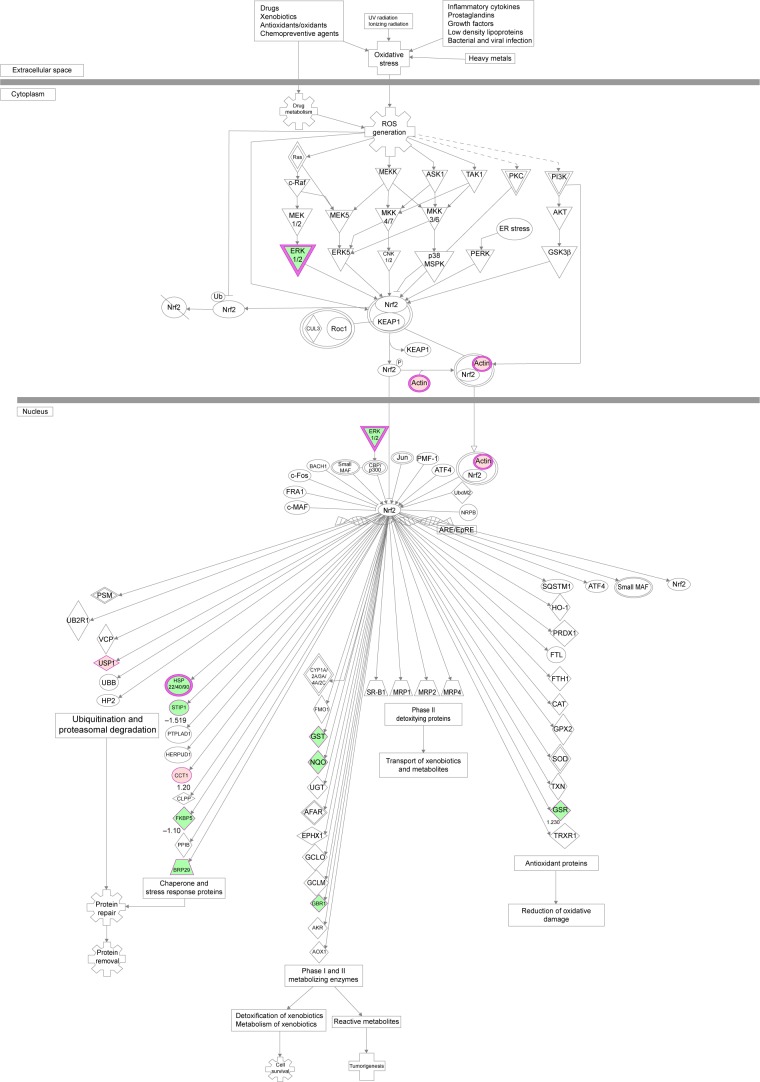
Figure 11.
PLB regulates Nrf2 oxidative signaling pathway in SCC25 cells.
Notes: SCC25 cells were treated with 5 μM PLB for 24 hours and the protein samples were subject to quantitative proteomic analysis. Red indicates upregulation; green indicates downregulation. The intensity of green and red molecule colors indicates the degree of down or upregulation, respectively. Solid arrows indicate direct interaction and dashed arrows indicate indirect interaction.
Abbreviations: PLB, plumbagin; UV, ultraviolet.

