
Figure 4.
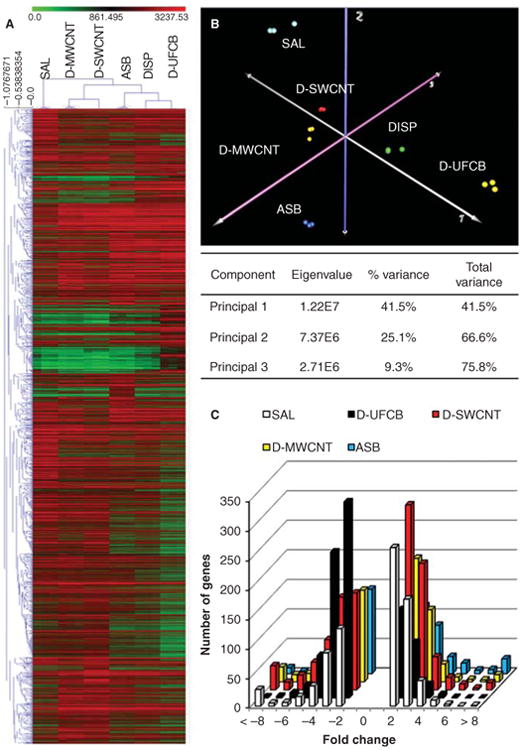
Unsupervised hierarchical cluster (HC) and principal component (PC) analysis of DEGs from cells subchronically exposed (6 months) to dispersed CNTs, asbestos and UFCB. A) D-SWCNT and D-MWCNT cells possessed similar genome expression signatures and differed substantially from asbestos-exposed, ultrafine carbon black and vehicle control signatures. B) PC analysis validation of HC analysis displaying differences between particle-exposed SAECs. C) Histogram comparison of up- and down-regulated DEGs compared to DISP control cells.