
Figure 6.
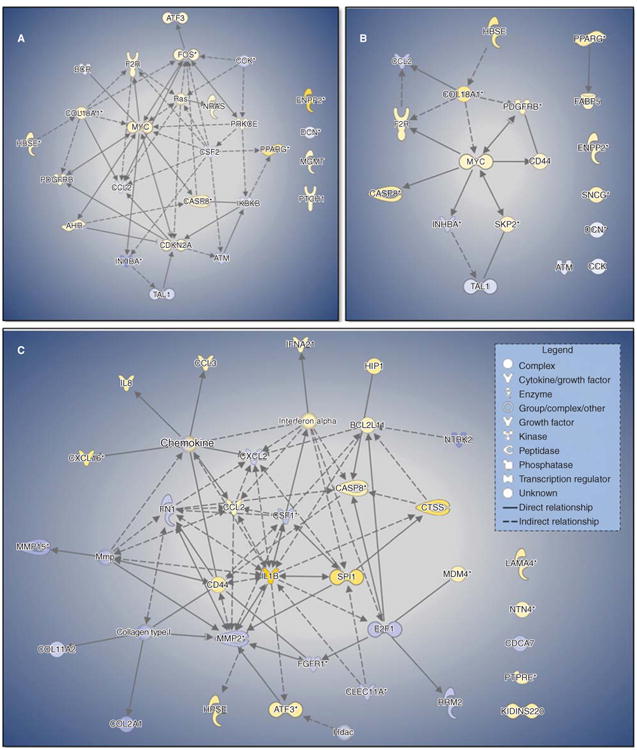
Cancer-promoting GSNs in A) D-SWCNT, B) D-MWCNT and C) ASB neoplastic-like transformed SAECs. DISP cell gene expression served as a comparative control. DEGs were first filtered for cancer-related activity. Next, genes that promoted cancer (over-expressed/promoted cancer and under-expressed/inhibited cancer) were included in the pathway. Genes were mapped with known direct and indirect signalling associations using IPA. Yellow and blue indicate over- and under-expressed genes, respectively, while intensity indicates magnitude of fold change.