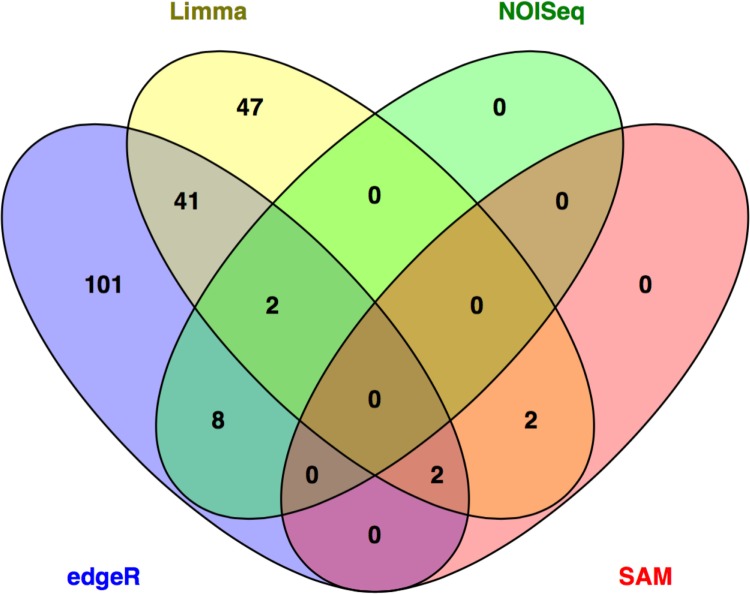
Figure 1.
Overlap among lists of differentially expressed genes detected in heterogeneous dataset using different methods. Limma and edgeR lists represent genes detected independent of method-specific settings, eg, Limma genes were detected using both default settings and sample weights (Supplementary Table 3).

