
Figure 2.
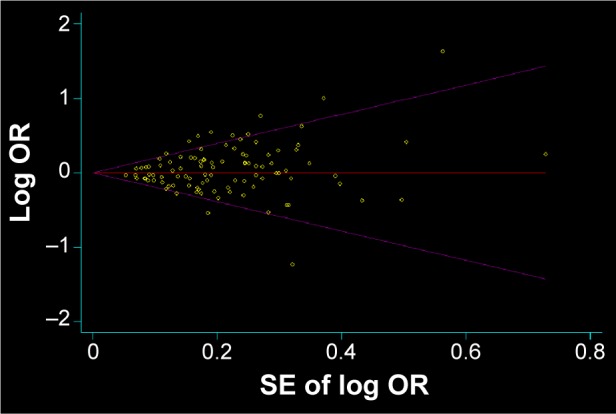
Begg’s funnel plot of the meta-analysis of cancer risk and COMT Val158Met polymorphism (AA + AG vs GG).
Note: Begg’s funnel plot with pseudo 95% confidence limits.
Abbreviations: COMT, catechol-O-methyltransferase; OR, odds ratio; SE, standard error.