
Figure 2.
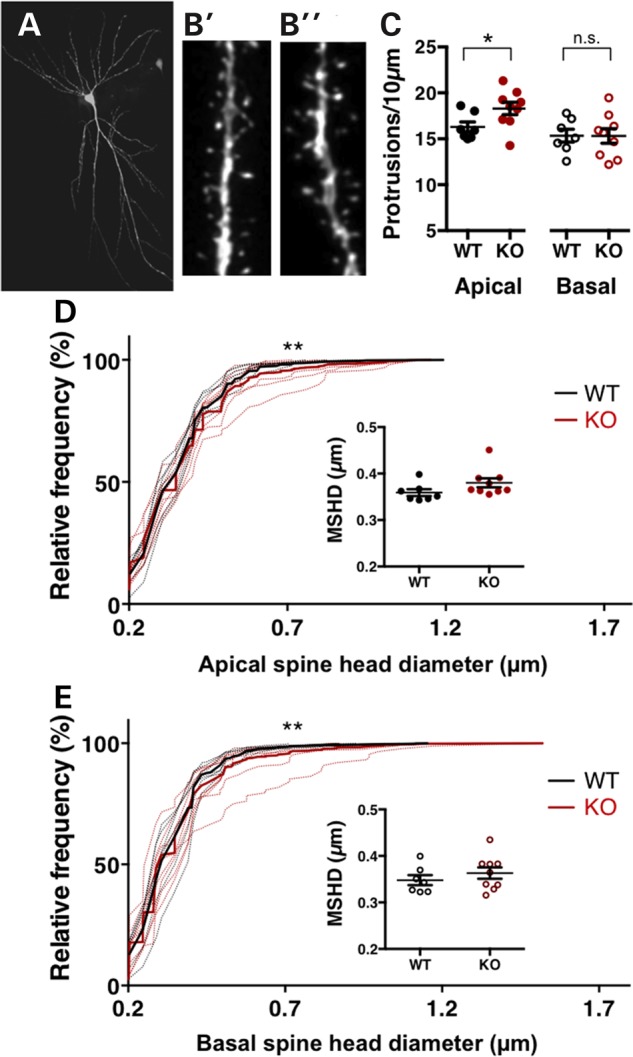
Altered dendritic spine density and shape in the hippocampus of Fmr1 KO rats. An example Alexafluor 568 filled hippocampal CA1 pyramidal neuron (A) and representative apical oblique dendritic segments from WT (B′) and Fmr1 KO rats (B″). (C) Quantification of the density of dendritic protrusions reveals a significant increase on secondary apical obliques in Fmr1 KO rats compared with WT control littermates. In contrast, spine density of secondary basal dendrites is comparable between genotypes. KS-tests of the cumulative frequency distributions indicate differences in the distribution profiles of spine head diameters on apical (D) and basal (E) CA1 dendrites between Fmr1 KO and WT rats. Dotted lines show the cumulative distribution for each animal, solid lines represent group means. The MSHD is not significantly different between genotypes.