
Figure 5.
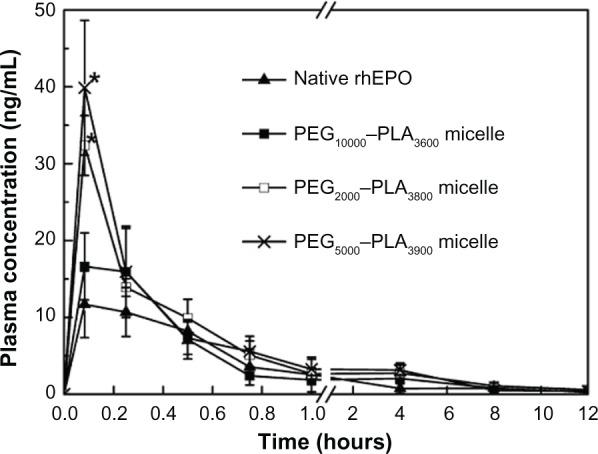
Plasma concentration versus time curve for rhEPO after IV administration of rhEPO-loaded PEG–PLA micelles (Table 2, batch 11, 15, and 16) (2000 IU/kg).
Notes: Each point represents mean ± SD (n = 5); *P < 0.05 (micelle group vs native rhEPO group).
Abbreviations: rhEPO, recombinant human erythropoietin; IV, intravenous; PEG– PLA, poly(ethylene glycol)–poly(d,l-lactide); SD, standard deviation.