
Figure 6.
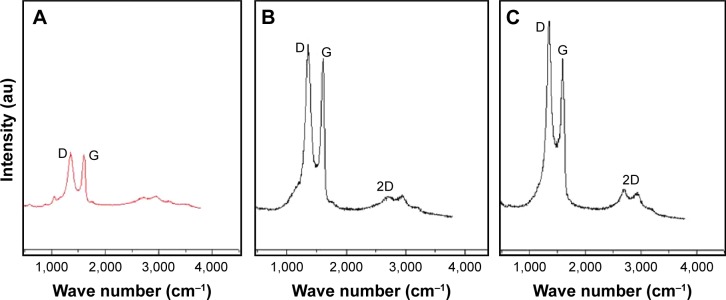
Raman spectroscopy analyses of (A) graphene oxide (GO), (B) reduced graphene oxide (rGO), and (C) rGO–Ag nanocomposite.
Notes: Raman spectra of (A) GO, (B) rGO, and (C) rGO–Ag nanocomposite were obtained using a laser excitation wavelength of 532 nm at the power of 1 mW after the removal of background fluorescence. The intensity ratio of the D to G bands (ID/IG) increases to 2.09 (rGO–Ag nanocomposite) from 1.74 (rGO) and 1.54 (GO). At least three independent experiments were performed for each sample and reproducible results were obtained.