
Fig. 3.
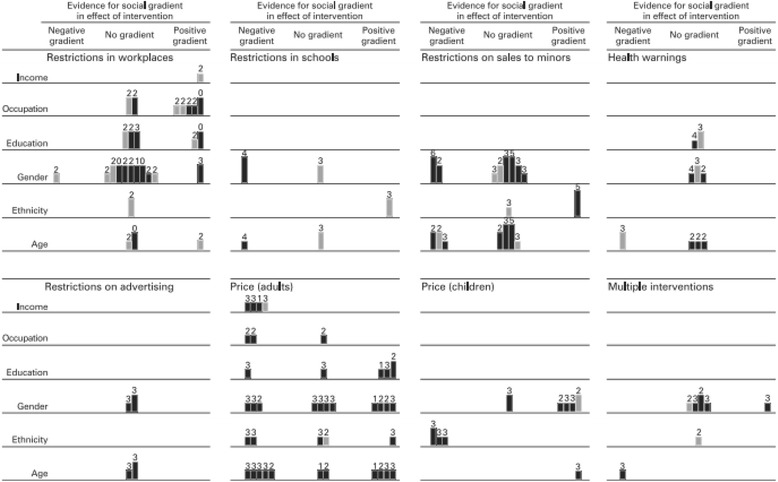
Harvest Plot. The ‘harvest plot’ synthesizes and displays the evidence to support possible social gradients in the effects of the intervention [18]
Official websites use .gov
A
.gov website belongs to an official
government organization in the United States.
Secure .gov websites use HTTPS
A lock (
) or https:// means you've safely
connected to the .gov website. Share sensitive
information only on official, secure websites.
Harvest Plot. The ‘harvest plot’ synthesizes and displays the evidence to support possible social gradients in the effects of the intervention [18]