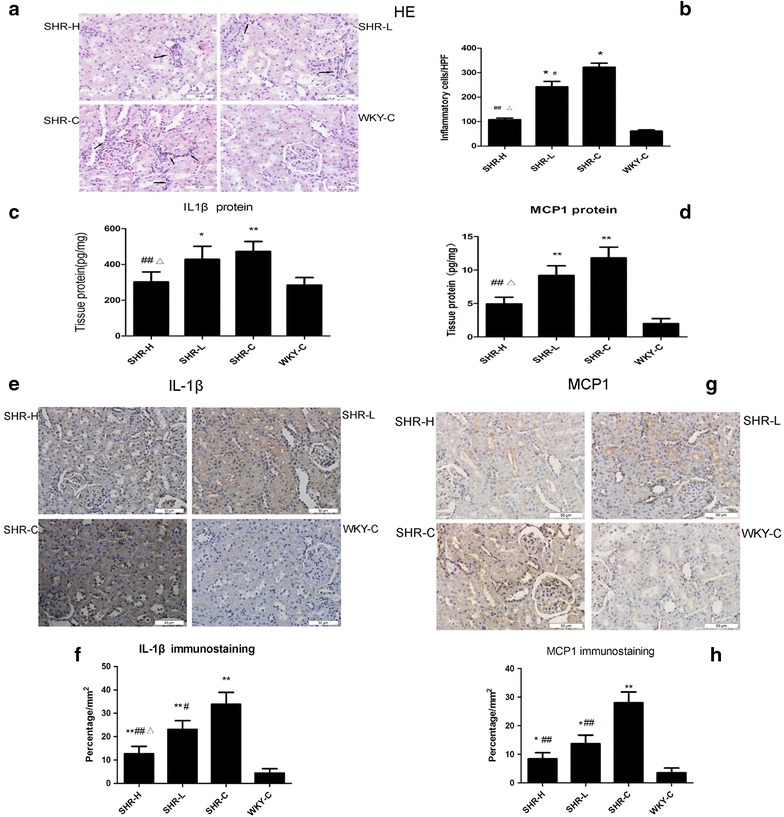
Fig. 1.

Renal inflammatory damage in hypertensive rats. a, b Tubulointerstitial inflammatory injury in the kidneys of SHRs and WKYs. a Haematoxylin and eosin (HE) staining of tubulointerstitial histopathology. The arrows indicate inflammatory cells. b The number of inflammatory cells (including monocytes, lymphocytes, macrophages, neutrophils) in tubulointerstitial areas of different HPFs (high-powered fields). c, d The protein expressions of IL-1β and MCP1 in rat kidneys were detected by ELISA. Results are expressed as pg/mg of total protein. e, f Renal sections show immunohistochemical staining of IL-1β, bar charts show quantification of IL-1β areas in each group. g, h Renal sections show immunohistochemical staining of MCP1, bar charts show quantification of MCP1 areas in each group. Data are presented as mean ± SD, n = 7 or 10. *P < 0.05, **P < 0.01 vs. WKY-C, #P < 0.05, ##P < 0.01 vs. SHR-C and ΔP < 0.05 vs. SHR-L by ANOVA. Original magnification ×400, Scar bar represents 50 μm
