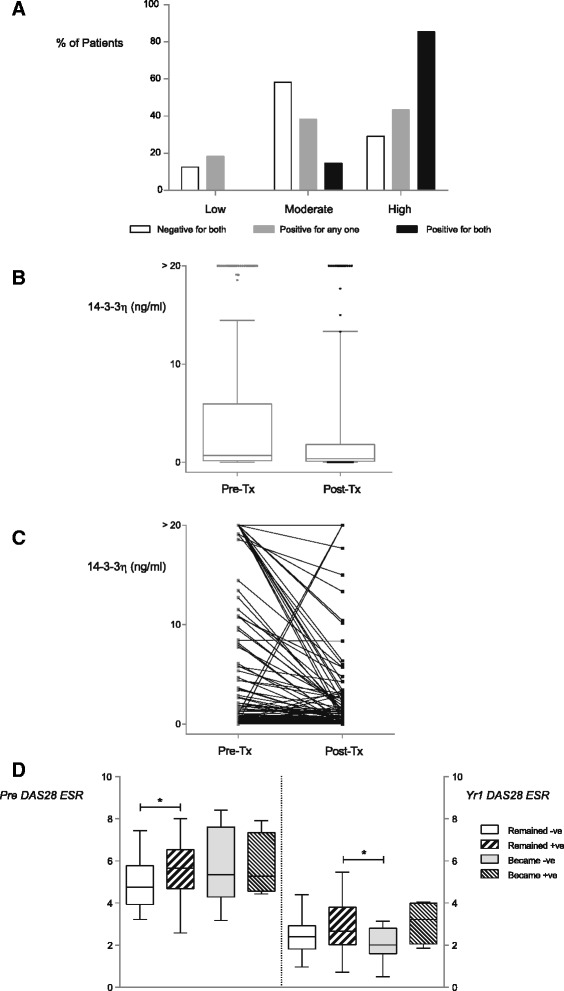
Fig. 1.

14-3-3η expression. a Clinical Disease Activity Index (CDAI)-defined disease states. The bar chart illustrates the relationship between 14-3-3η and/or C-reactive protein positivity and CDAI-defined disease status, b Changes between pre- and posttreatment. The box plot shows the change median levels of 14-3-3η over time, c Pairing by patient. The graph illustrates individual patients’ changes between pretreatment and posttreatment 14-3-3η serum levels. d Disease Activity Score in 28 joints with erythrocyte sedimentation rate (DAS28-ESR) based on changes in 14-3-3η expression. The box plot illustrates changes in median DAS28-ESR expression as 14-3-3η positivity changes over time. *Significance values were calculated using Dunn’s posttest
