
Fig. 1.
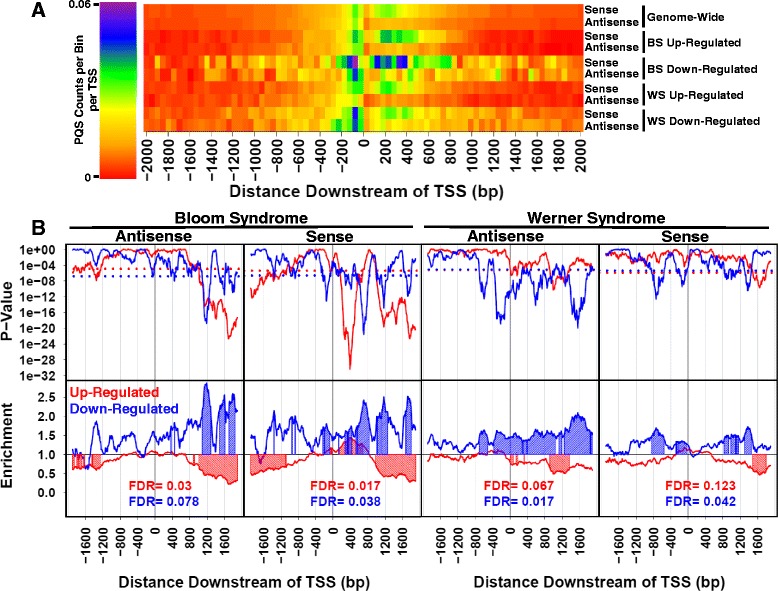
PQS occurrence in genes differentially expressed in BS and WS. PQS occurrence in sense (S) and antisense (AS) strands was analyzed independently. a Heat map showing PQS occurrence genome-wide and in genes differentially-expressed in BS and WS, represented as raw counts normalized to total number of TSS in each dataset. b Top panels show p-values for comparing PQS abundance per TSS between genes differentially expressed in BS and WS and all other genes. Dotted lines represent p-value cutoffs for determining statistical significance, with less than 1 % of data points from a random gene dataset of the same size as the test dataset having a p-value below this threshold. Bottom panels show PQS enrichment ratio in genes differentially expressed in BS and WS, with values > 1 indicating that PQS are more abundant in the differentially-expressed gene set. Both p-values and enrichment ratios were calculated using a 200 bp bin value repeated at a 10 bp interval. Regions with shaded peaks represent locations of statistically-significant PQS excess or scarcity