
Fig. 4.
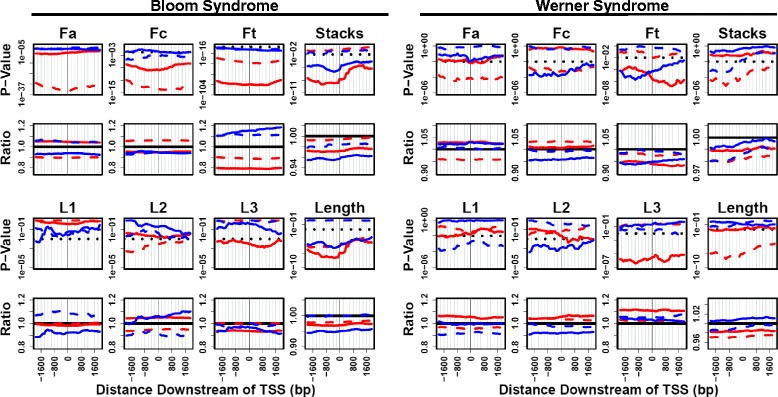
PQS motif characteristics in genes differentially expressed in BS and WS analyzed via ANOVA. PQS motif characteristics (total sequence length, loop lengths, base fractions, and number of G-stacks) in genes differentially expressed in BS and WS. P-values and ratios for comparison to the genome-wide distribution are calculated using a 200 bp bin selection, repeated at a 50 bp interval, and in reference to corresponding PQS position on antisense (AS) strand or sense (S) strand for all genes. Red = genes up-regulated in BS and WS. Blue = genes down-regulated in BS and WS. Solid line = AS. Dashed line = S