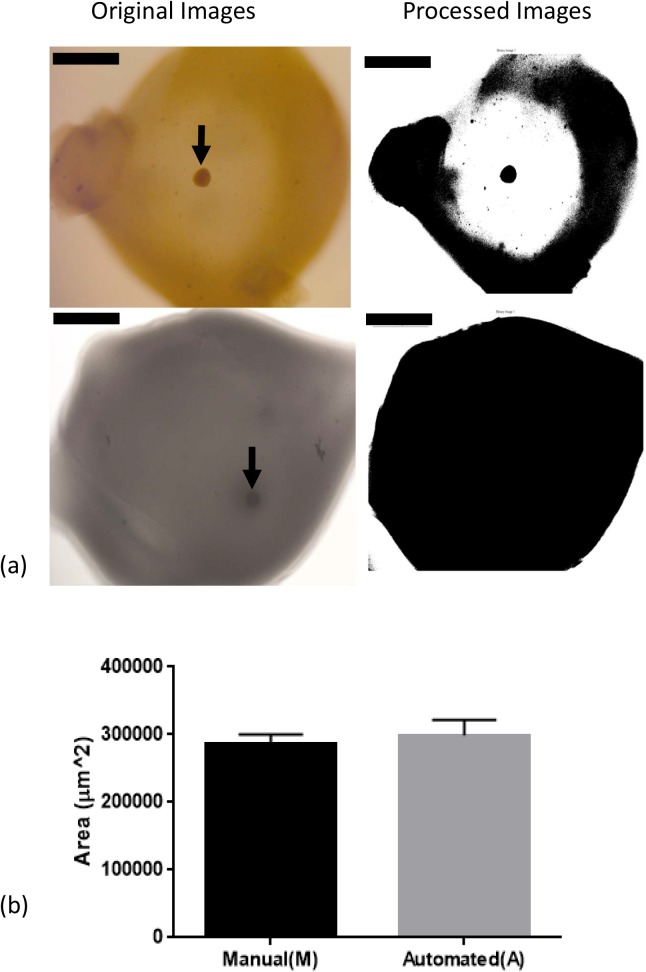
Fig 2. Correlation of fibrin degradation and follicle health, evaluated by both manual calculation (M) and automated MATLAB ® program (A).
(a) Representative images of a live follicle (top) and a dead follicle (bottom) in brightfield images and processed binary images. Scale bar = 800 μm. (b) Results from manual calculation (M) and automated program measurement (A) of fibrin degradation in GM+Apr condition for live follicles on D6. Data presented as mean ± SEM, with n = 9 in each case.

