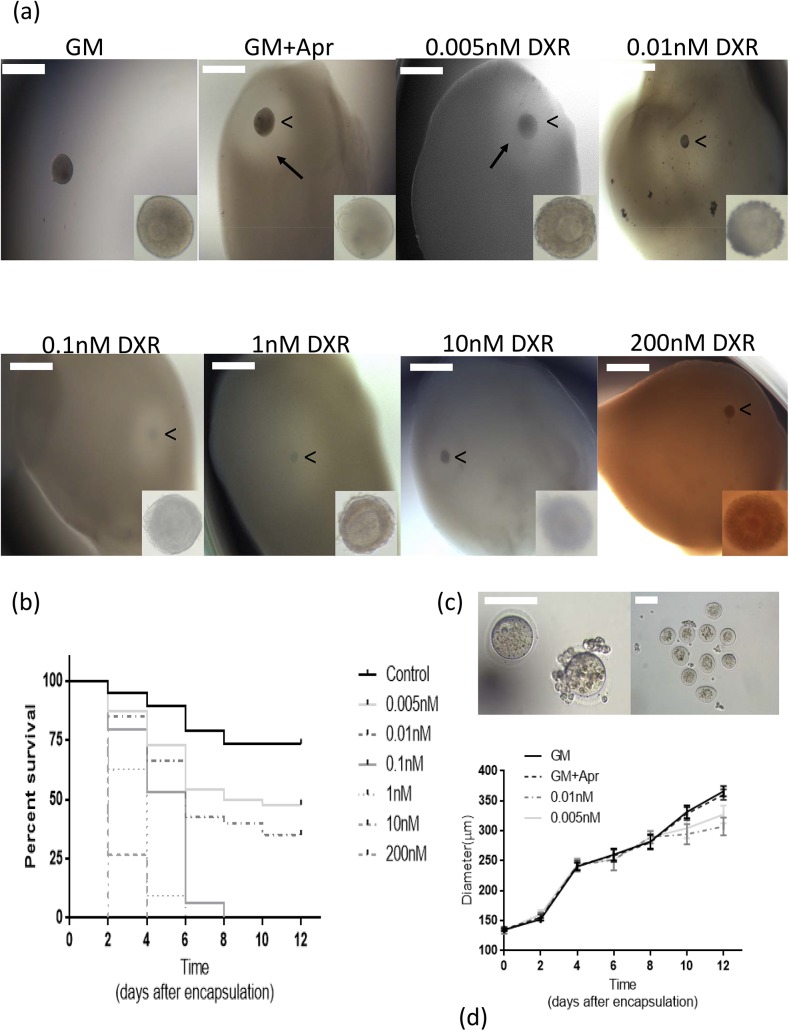
Fig 4. System validation with Doxorubicin (DXR).
(a) Representative images of dose response of cultured follicles to DXR. Arrow points to the fibrin degradation area surrounding the growing follicle. Arrow head (“<”) points to the encapsulated follicle in the FA-IPN. Scale bar = 500 μm. (b) Kaplan-Meier cumulative survival curves for DXR treatments and control. Sample sizes for each condition [n (condition) = total follicles, animal used, experiments]: n (200 nM) = 69, 4, 3; n (10 nM) = 52, 3, 3; n (1 nM) = 75, 3, 3; n (0.1 nM) = 75, 3, 3; n (0.01 nM) = 80, 3, 3; n (0.005 nM) = 92, 4, 3. (c) Representative images of in vitro follicle maturation (IVFM) results from survived follicles in the 0.01 nM (left) and 0.005 nM (right) DXR treatment group. Scale bar = 100 μm. (d) The diameters of surviving follicles in control conditions (GM and GM+Apr) and 0.005 nM and 0.01 nM DXR treatment groups. Data presented as mean ± SEM.

