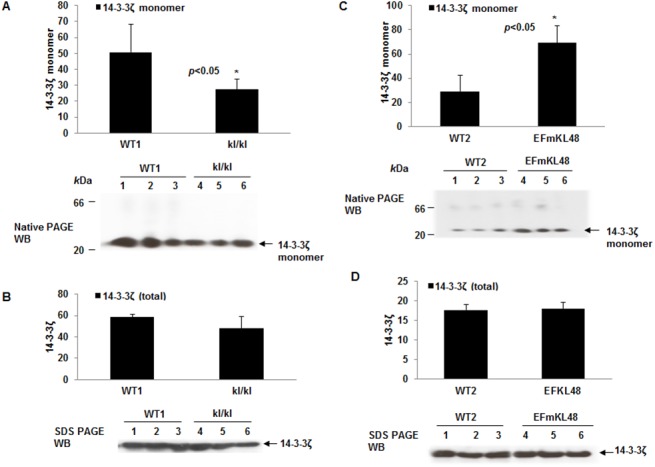
Fig 5. Basal levels of 14-3-3ζ monomer in Klotho KO and Klotho transgenic mice.

(A) Plot of native PAGE Western blot of WT1 and kl/kl mice probed with 14-3-3ζ antibody. The 14-3-3ζ antibody recognizes a predominant ~30 kDa protein band representing the expected size of a monomer. *p< 0.05, between WT1 and kl/kl. (B) Replicate samples were separated under SDS-PAGE, electroblotted onto PVDF membrane and probed with same antibody to account for lysate levels of total 14-3-3ζ. (C) Native PAGE Western blot of WT2 verses EFmKL48 performed under identical conditions described for (A). *p< 0.05, between WT2 and EFmKL48. (D) Replicate samples were separated under SDS-PAGE, electroblotted onto PVDF membrane and probed with same antibody to account for lysate levels of total 14-3-3ζ. Digitized values of the WB signals used in the plots are shown in S5 and S6 Tables.
