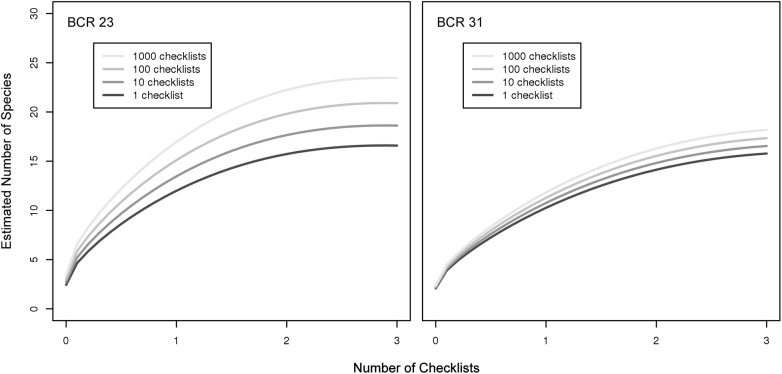
Fig 8. The change in SACs as a function of the cumulative participation in eBird.
We estimated average changes in shapes of species accumulation curves with increasing number of checklists submitted to eBird from our BCR-specific models of species accumulation curves, to visualize whether observers report more species after they have submitted more eBird checklists. Note that while increased participation leads to a higher rate of accumulation of species, this effect is highest for beginning participants and slows with increased participation.

