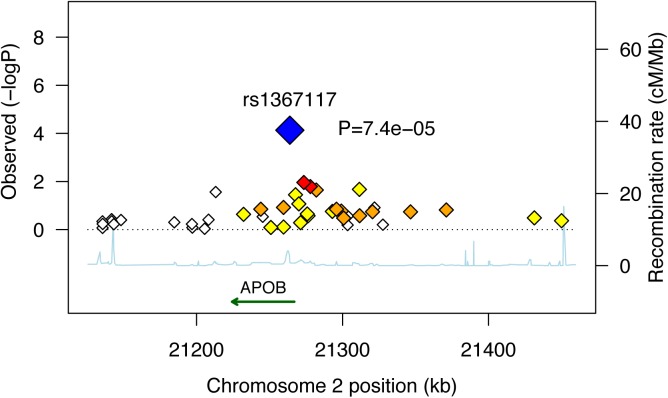
Fig 2. Combined* maternally-derived effects of SNPs spanning the APOB locus on BMI.
Forty two SNPs spanning the APOB genomic locus with their corresponding meta-analysis (z-based) p-values for the maternally-derived associations (as -log10 values) are plotted as a function of chromosomal position. Estimated recombination rates are plotted to reflect the local LD structure around the associated SNP (blue) and its correlated proxies (red:R2≥0.8; orange:0.5≥R2>0.8; yellow:0.2≥R2>0.5; white:R2<0.2). Combined (Z-based) p-value for APOB SNP rs1367117 excluding JPS is 7.4x10⁻⁵ (presented in figure). Corresponding p-value including JPS is 7.8x10⁻⁶ (presented in Table 1). *Results used to generate the plot are based on genome-wide data available in FHS, FamHS and ERF (and not including JPS where data are not available).

