
Fig. 3.
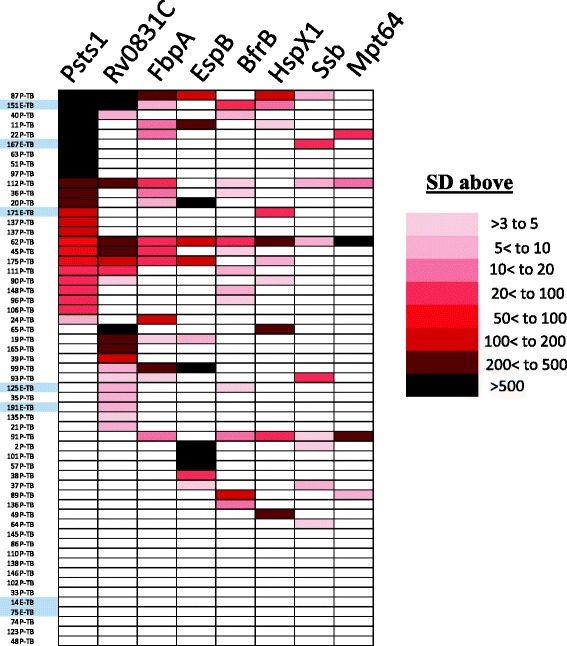
Heat map representation of patient antibody profiles against MTB antigens. Antibody responses of each TB-infected subject against eight MTB antigens was color-coded using the Z-score scale shown on the right representing the number of standard deviations above the mean of the controls for that antigen. Coloring in the heat map indicates that the relative antibody levels are at least greater than the mean of the controls plus three standard deviations. The pulmonary TB (P-TB) and extrapulmonary TB (E-TB; grey coded) patients are listed on the left and rank ordered based on immunoreactivity with the eight MTB antigens